Advertisements
Advertisements
Question
From the curve y = sin x, graph the function
y = − sin(−x)
Solution
y = sin x
| x | 0 | `pi/2` | π | `3 pi/2` | 2π | `- pi/2` | – π | `- 3 pi/2` | – 2π |
| y | 0 | 1 | 0 | – 1 | 0 | – 1 | 0 | 1 | 0 |

y = − sin(−x)
| x | 0 | `pi/2` | π | `3 pi/2` | 2π | `- pi/2` | – π | `- 3 pi/2` | – 2π |
| y | 0 | 1 | 0 | – 1 | 0 | – 1 | 0 | 1 | 0 |
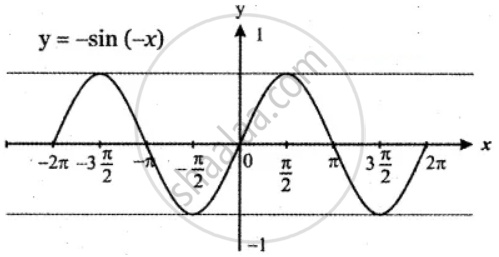
y = – sin(– x) is the reflection of y = sin(– x) about the x-axis.
The graph of y = – f(x) is the reflection of the graph of y = f(x) about x-axis.
APPEARS IN
RELATED QUESTIONS
For the curve y = x3 given in Figure 1.67, draw
y = x3 + 1 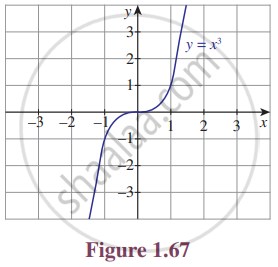
For the curve y = x3 given in Figure 1.67, draw
y = x3 − 1
For the curve y = `x^((1/3))` given in Figure 1.68, draw
y = `- x^((1/3))`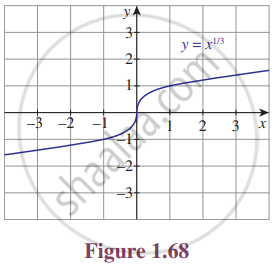
For the curve y = `x^((1/3))` given in Figure 1.68, draw
y = `(x + 1)^((1/3))`
From the curve y = sin x, graph the function.
y = sin(− x)
From the curve y = sin x, graph the function
y = `sin (pi/2 - x)` which is also cos x (refer trigonometry)
From the curve y = x, draw y = − x
From the curve y = x, draw y = 2x
From the curve y = x, draw y = x + 1
From the curve y = x, draw 2x + y + 3 = 0
From the curve y = |x|, draw y = |x − 1| + 1
From the curve y = |x|, draw y = |x + 1| − 1
From the curve y = |x|, draw y = |x + 2| − 3
From the curve y = sin x, draw y = sin |x| (Hint: sin(−x) = − sin x)
