Advertisements
Advertisements
Question
From the given pie chart, we can infer that production of Manganese is least in state B.

Options
True
False
Solution
This statement is False.
Explanation:
No we cannot infer, from the given pie chart that the production of manganese is least in state B since we do not know the central angle of the sectors.
APPEARS IN
RELATED QUESTIONS
Draw a pie chart showing the following information. The table shows the colours preferred by a group of people.
| Colours | Number of people |
| Blue | 18 |
| Green | 9 |
| Red | 6 |
| Yellow | 3 |
| Total | 36 |
Find the proportion of each sector. For example, blue is `18/36 = 1.2` ; green is `9/36 = 1/4` and so on. Use this to find the corresponding angles.
In a tree plantation programme, the number of trees planted by students of different classes is given in the following table. Draw a pie diagram showing the information.
| Standard | 5th | 6th | 7th | 8th | 9th | 10th |
| No. of trees | 40 | 50 | 75 | 50 | 70 | 75 |
The following data shows the expenditure of a person on different items during a month. Represent the data by a pie-chart.
| Items of expenditure | Rent | Education | Food | Clothing | Others |
| Amount (in Rs) | 2700 | 1800 | 2400 | 1500 | 2400 |
The percentages of various categories of workers in a state are given in the following table.
| Categoies | Culti-vators | Agricultural Labourers | Industrial Workers | Commercial Workers | Others |
| % of workers | 40 | 25 | 12.5 | 10 | 12.5 |
Present the information in the form a pie-chart.
The following data gives the amount spent on the construction of a house. Draw a pie diagram.
| Items | Cement | Timber | Bricks | Labour | Steel | Miscellaneous |
| Expenditure (in thousand Rs) |
60 | 30 | 45 | 75 | 45 | 45 |
The following table shows causes of noise pollution. Show it by a pie diagram.
|
Construction
|
Traffic | Aircraft take offs | Industry | Trains |
| 10% | 50% | 9% | 20% | 11% |
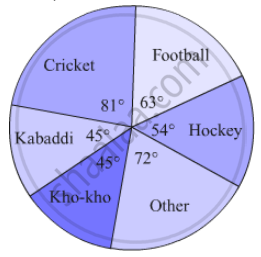
A survey of students was made to know which game they like. The data obtained in the survey is presented in the adjacent pie diagram. If the total number of students are 1000,

(1) How many students like cricket ?
(2) How many students like football ?
(3) How many students prefer other games ?
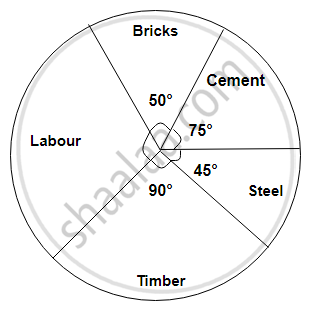
The following diagram represents expenditure on different items in constructing a building.
If the total construction cost of a building is Rs.540000, answer the following questions :
Find the expenditure on labour.

The marks obtained by a student in an examination are given below:
| Subject | Marks |
| Marathi | 85 |
| Hindi | 80 |
| English | 95 |
| Mathematics | 100 |
| Total | 360 |
Represent the data using pie diagram.
| ordinary bread | 320 |
| fruit bread | 80 |
| cakes and pastries | 160 |
| biscuits | 120 |
| others | 40 |
|
Total
|
720 |
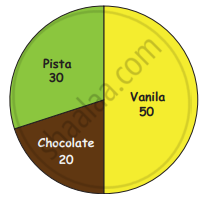
The number of varieties of ice creams in an ice cream parlour is given below as a pie-chart.
(i) How many varieties of Ice creams are there?
(ii) Find the number of Vanilla Ice creams ______.
(iii) Find the total number of Chocolate and Pista Ice cream _______.
(iv) Find the total number of Ice creams _______.
In a pie chart, the total angle at the centre of the circle is ______.
Students of a class voted for their favourite colour and a pie chart was prepared based on the data collected.
Observe the pie chart given below and answer questions based on it.

Which colour received `1/5` of the votes?
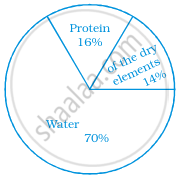
The following pie chart gives the distribution of constituents in the human body. The central angle of the sector showing the distribution of protein and other constituents is ______.

What is the central angle of the sector representing skin and bones together?

Sum of all the central angles in a pie chart is 360°.
In a pie chart two or more central angles can be equal.
The following data represents the different number of animals in a zoo. Prepare a pie chart for the given data.
| Animals | Number of animals |
| Deer | 42 |
| Elephant | 15 |
| Giraffe | 26 |
| Reptiles | 24 |
| Tiger | 13 |
In the time table of a school, periods allotted per week to different teaching subjects are given below:
| Subject | Hindi | English | Maths | Science | Social Science |
Computer | Sanskrit |
| Periods Allotted |
7 | 8 | 8 | 8 | 7 | 4 | 3 |
Draw a pie chart for this data.
