Advertisements
Advertisements
Question
Out of 10 students, who appeared in a test, three secured less than 30 marks and 3 secured more than 75 marks. The marks secured by the remaining 4 students are 35, 48, 66 and 40. Find the median score of the whole group.
Solution
Here, total observations = n = 10 (even)
Thus, we have
Median =`1/2[ "value of"(10/2)^"th""term"+"value of"((10)/(2)+1)^"th""term"]`
=`1/2[ "valueof" 5^"th" "term"+"value of "6^"th" "term"]`
According to the given information, data in ascending order is as follows:
| 1 st Term | 2nd Term | 3rd Term | 4th Term | 5th term | 6th Term | 7th Term | 8th Term | 9th term | 10th term | |
| Marks | Less than 30 | 35 | 40 | 48 | 66 | More than 75 | ||||
∴ Median =`1/2(40 + 48) = 88/2 =44`
Hence, the median score of the whole group is 44.
APPEARS IN
RELATED QUESTIONS
Calculate the mean of the distribution given below using the shortcut method.
| Marks | 11-20 | 21-30 | 31-40 | 41-50 | 51-60 | 61-70 | 71-80 |
| No. of students | 2 | 6 | 10 | 12 | 9 | 7 | 4 |
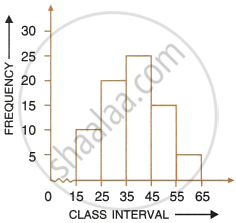
Using the information given in the adjoining histogram, calculate the mean.

Find the mode of the following frequency distribution:
| Variate | 20 | 21 | 22 | 23 | 24 | 25 | 26 |
| Frequency | 21 | 20 | 26 | 35 | 22 | 13 | 10 |
The marks of 200 students in a test is given below :
| Marks% | 10-19 | 20-29 | 30-39 | 40-49 | 50-59 | 60-69 | 70-79 | 80-89 |
| No. of Students | 7 | 11 | 20 | 46 | 57 | 37 | 15 | 7 |
Draw an ogive and find
(i) the median
(ii) the number of students who scored more than 35% marks
Estimate the median, the lower quartile and the upper quartile of the following frequency distribution by drawing an ogive:
| Marks(more than) | 90 | 80 | 70 | 60 | 50 | 40 | 30 | 20 | 10 | 0 |
| No. of students | 6 | 13 | 22 | 34 | 48 | 60 | 70 | 78 | 80 | 80 |
Find the mean of first six natural numbers.
The mean of a certain number of observations is 32. Find the resulting mean, if the observation is, divided by 0.5
The rainfall (in mm) in a city on 7 days of a certain week is recorded as follows:
| Day: | Mon | Tue | Wed | Thus | Fri | Sat | Sun |
| Rainfall (in mm): | 0.5 | 2.7 | 2.6 | 0.5 | 2 | 5.8 | 1.5 |
Find the total and average (mean) rainfall for the week.
The median class for the given distribution is:
| Class Interval | 1 - 5 | 6 - 10 | 11 - 15 | 16 - 20 |
| Cumulative Frequency | 2 | 6 | 11 | 18 |
Median is one of the observations in the data if number of observations is ______.
