Advertisements
Advertisements
Question
Push factors and pull factors of migration.
Solution
| Push factors | Pull factors |
| These factors are the ones which makes a place less attractive for human settlement. | These factors are the ones which makes a place an attractive destination for settlement. |
| These factors forces people to move out - hence face emigration. | These factors force inflow of people - hence face immigration. |
| Examples: Unemployment, poor living conditions, political turmoil, unpleasant climate, natural disasters, epidemics and socio-economic backwardness. | Examples: Better job opportunities, better living conditions, peace and stability, security of life and property and pleasant climate. |
APPEARS IN
RELATED QUESTIONS
What is ‘carrying capacity’ of a species in a habitat ? Why is logistic growth model considered more realistic?
If the birth rate is greater than the death rate then the population ______.
Examine the following statement and correct the incorrect one.
Developing countries have an HDI of 1.
Give Geographical Reason.
The real progress of a country is understood with the help of the Human Development Index.
Give a geographical reason:
Population may increase though birth rates are low.
Assertion: Population of a region does not change.
Reason: Birth rate, death rate and migration affect the population of a region.
Differentiate between
Crude Birth Rate and Crude Death Rate
Which one of the following is not a push factor?
What are the three components of population change?
Birth rate and death rate.
What is population doubling time?
Which country has the highest and lowest growth rate of the population respectively?
What is the impact of migration?
What is population growth? What does population change indicate for an area?
Distinguish between the place of origin and the place of destination.
How did science and technology help in population growth?
Define the term ‘positive growth of population’.
Why do people migrate in large numbers from rural to urban areas in India?
How many stages/phases of population growth?
What was the population of India as per the 2011 Census?
The continent that has the lowest growth rate of population.
Which of the following is not a pull factor?
The country having lowest growth rate of population.
The ten most populated countries have a ______ world population.
Which is the most populated country?
Which of the following attributes has not been adversely affected by Age and Skill selective migration?

Which is not in stage III?
When the birth rate is more than the death rate between two points of time, it is known as ______
Study the given graph carefully and answer the following question:
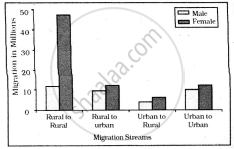
Intra-state Migration by place of Last Residence Indicating Migration Streams India, 2011
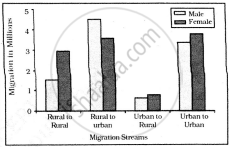
Inter-state Migration by Place of Last Residence Indicating Migration Streams India, 2011
Who dominates the inter-state migration of short distances?
The number of mice in a laboratory was 100 on a particular day. After one year their number increased to 120. Calculate the growth rate in the population.
Ratio between mortality and neutrality is called ______.
In an exponential bacterial culture, the number of cells/ml is plotted o half log group. The growth is ______.
Exponential growth in plants win be expressed as ______.
Crude Death Rate (CDR):-
Which of the following pairs is not correctly matched?
If a population of 50 Paramoecium present in a pool increases to 150 after an hour, what would be the growth rate of population?
In 2005, for each of the 14 million people present in a country, 0.028 were born and 0.008 died during the year. Using exponential equation, the number of people present in 2015 is predicted as ______.
What would be the growth rate pattern, when the resources are unlimited?
Swathi was growing a bacterial colony in a culture flask under ideal laboratory conditions where the resources are replenished. Which of the following equations will represent the growth in this case?
(Where population size is N, birth rate is b, death rate is d, unit time period is t, and carrying capacity is K).
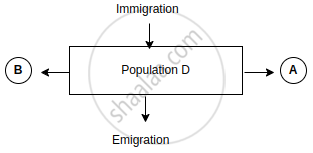
Observe the schematic representation given above and answer the following questions:
- Identify A and B.
- Calculate the growth rate of bacteria in a curd sample, where 1 million bacteria increased to two million, within a period of one hour.
Analyse the different aspects of population growth in India during 1901-1921 and 1921-1951.
Consider the following and choose the correct answer with the help of given codes-
| STAGES OF POPULATION | GROWTH FEATURES |
| I Period between 1901 to 1921 | 1. Period of steady growth |
| II Period between 1921 to 1951 | 2. Phase of stagnant growth of Population |
| III Period between 1951 to 1981 | 3. High but decreasing growth rate |
| IV After 1981 till present | 4. Period of population explosion |
Assertion (A): Population of a region does not change.
Reasoning (R): Birth rate, death rate and migration affect the population of a region.
Assertion (A): Population of a region does not change.
Reasoning (R): Birth rate, death rate and migration affect the population of a region.
Assertion (A): Population of a region does not change.
Reason (R): Birth rate, death rate and migration affect the population of a region.
Assertion (A): Population of a region does not change.
Reasoning (R): Birth rate, death rate and migration affect the population of a region.
Assertion: Population of a region does not change.
Reasoning: Birth rate, death rate and migration affect the population of a region.
