Advertisements
Advertisements
Question
The following table shows classification of number of workers and number of hours they work in software company. Prepare less than upper limit type cumulative frequency distribution table:
| Number of hours daily | Number of workers |
| 8 - 10 | 150 |
| 10 - 12 | 500 |
| 12 - 14 | 300 |
| 14 - 16 | 50 |
Solution
| Number of hours daily | Number of workers | Cumulative Frequency |
| 8 - 10 | 150 | 150 |
| 10 - 12 | 500 | 150 + 500 = 650 |
| 12 - 14 | 300 | 650 + 300 = 950 |
| 14 - 16 | 50 | 950 + 50 = 1000 |
APPEARS IN
RELATED QUESTIONS
For a certain frequency distribution, the value of mean is 20 and mode is 11. Find the value of median.
If the median of the distribution given below is 28.5, find the values of x and y.
| Class interval | Frequency |
| 0 - 10 | 5 |
| 10 - 20 | x |
| 20 - 30 | 20 |
| 30 - 40 | 15 |
| 40 - 50 | y |
| 50 - 60 | 5 |
| Total | 60 |
The marks obtained by 30 students in a class assignment of 5 marks are given below.
| Marks | 0 | 1 | 2 | 3 | 4 | 5 |
| No. of Students |
1 | 3 | 6 | 10 | 5 | 5 |
Calculate the mean, median and mode of the above distribution
Calculate the missing frequency from the following distribution, it being given that the median of the distribution is 24.
| Age in years | 0 - 10 | 10 - 20 | 20 - 30 | 30 - 40 | 40 - 50 |
| No. of persons | 5 | 25 | ? | 18 | 7 |
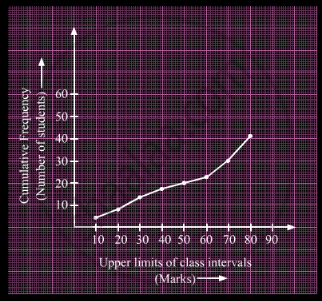
A student draws a cumulative frequency curve for the marks obtained by 40 students of a class as shown below. Find the median marks obtained by the students of the class.

Calculate the median of the following distribution:
| No. of goals | 0 | 1 | 2 | 3 | 4 | 5 |
| No. of matches | 2 | 4 | 7 | 6 | 8 | 3 |
The median of set of 9 distinct observations is 20.5. If each of the largest 4 observations of the set is increased by 2, then the median of the new set ______.
Consider the data:
| Class | 65 – 85 | 85 – 105 | 105 – 125 | 125 – 145 | 145 – 165 | 165 – 185 | 185 – 205 |
| Frequency | 4 | 5 | 13 | 20 | 14 | 7 | 4 |
The difference of the upper limit of the median class and the lower limit of the modal class is:
The median of the following frequency distribution is 25. Find the value of x.
| Class: | 0 – 10 | 10 – 20 | 20 – 30 | 30 – 40 | 40 – 50 |
| Frequency: | 6 | 9 | 10 | 8 | x |
Find the modal and median classes of the following distribution.
| Class | 0 – 20 | 20 – 40 | 40 – 60 | 60 – 80 | 80 – 100 |
| Frequency | 11 | 22 | 19 | 18 | 7 |
