Advertisements
Advertisements
Question
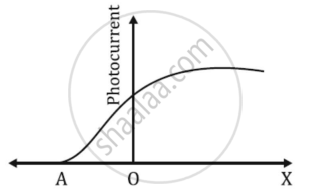
The graph shows the variation of photocurrent for a photosensitive metal
- What does X and A on the horizontal axis represent?
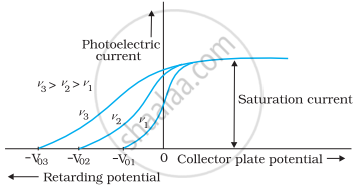
- Draw this graph for three different values of frequencies of incident radiation ʋ1, ʋ2 and ʋ3 (ʋ3 > ʋ2 > ʋ1) for the same intensity.
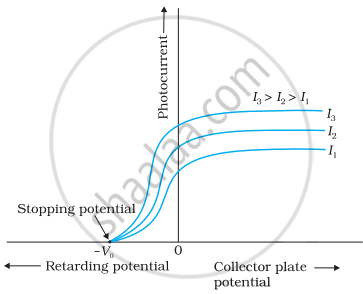
- Draw this graph for three different values of intensities of incident radiation I1, I2 and I3 (I3 > I2 > I1) having the same frequency.
Solution
a. A - cut off or stopping potential
X - anode potential
b. 
Variation of photoelectric current with collector plate potential for different frequencies of incident radiation.
c.
Variation of photocurrent with collector plate potential for different intensity of incident radiation.
APPEARS IN
RELATED QUESTIONS
The photoelectric cut-off voltage in a certain experiment is 1.5 V. What is the maximum kinetic energy of photoelectrons emitted?
Draw graphs showing variation of photoelectric current with applied voltage for two incident radiations of equal frequency and different intensities. Mark the graph for the radiation of higher intensity.
Is it always true that for two sources of equal intensity, the number of photons emitted in a given time are equal?
Planck's constant has the same dimensions as
A point source of light is used in a photoelectric effect. If the source is removed farther from the emitting metal, the stopping potential
When the intensity of a light source in increased,
(a) the number of photons emitted by the source in unit time increases
(b) the total energy of the photons emitted per unit time increases
(c) more energetic photons are emitted
(d) faster photons are emitted
The collector plate in an experiment on photoelectric effect is kept vertically above the emitter plate. A light source is put on and a saturation photocurrent is recorded. An electric field is switched on that has a vertically downward direction.
When the sun is directly overhead, the surface of the earth receives 1.4 × 10³ W m−2 of sunlight. Assume that the light is monochromatic with average wavelength 500 nm and that no light is absorbed in between the sun and the earth's surface. The distance between the sun and the earth is 1.5 × 10¹¹ m. (a) Calculate the number of photons falling per second on each square metre of earth's surface directly below the sun. (b) How many photons are there in each cubic metre near the earth's surface at any instant? (c) How many photons does the sun emit per second?
(Use h = 6.63 × 10⁻³⁴J-s = 4.14 × 10⁻¹⁵ eV-s, c = 3 × 10⁸ m/s and me = 9.1 × 10⁻³¹kg)
The electric field associated with a light wave is given by `E = E_0 sin [(1.57 xx 10^7 "m"^-1)(x - ct)]`. Find the stopping potential when this light is used in an experiment on photoelectric effect with the emitter having work function 1.9 eV.
Define the terms "stopping potential' and 'threshold frequency' in relation to the photoelectric effect. How does one determine these physical quantities using Einstein's equation?
