Advertisements
Advertisements
Question
What is the significance of age-structure?
Solution
Age structure represents the number of people of different age groups. This is an important indicator of population composition, since a large size of population in the age group of 15-59 indicates a large working population. A greater proportion of population above 60 years represents an ageing population which requires more expenditure on health care facilities. Similarly high proportion of young population would mean that the region has a high birth rate and the population is youthful.
APPEARS IN
RELATED QUESTIONS
Identify the correct co-relation :
A: Assertion; R: Reasoning
A: In the population pyramid, a broad base indicates a high number of children in a country.
R: Broad apex is an indicator of the high number of elderly in a country
Write a short note on:
Population pyramid and sex ratio.
Give a geographical reason:
In developed countries, the percentage of the population engaged in agriculture is low.
Give a geographical reason:
Demographic dividend increases when the proportion of the working population increases.
A person who can write, read and do mathematical calculations in the country is known as ______.
Assertion: The working population classified according to occupations is known as occupational structure.
Reason: Occupational structure indicates development of a country.
Give geographical reason
Less population is engaged in agriculture in developed countries
Give geographical reason
Demographic dividend increases when proportion of working population increases.
Identify the incorrect factor
Regions having sex ratio more than one thousand:
Identify the incorrect factor
Characteristics of constrictive pyramid:
Observe the following graph and answer the question given below

Question:
- Which region has the highest literacy rate?
- Which region has the lowest literacy rate?
- In which region does women fare better than men in literacy rate?
- Write a concluding paragraph about the graph.
- Which is the type of graph?
Observe the following graph and answer the question given below:

Question:
- Which type of the graph shown above?
- In which age group male percentage is highest?
- In which age group female percentage is lowest?
- Whose percentage is highest in 30-39 age group?
- In which age group female percentage is higher than male percentage?
Write short note
Occupational structure of India
Write short note.
Literacy and education
Write short note
Rural-urban structure of population
‘The agricultural sector has the largest share of Indian workers.’ – Explain.
Which regions have an unfavorable sex ratio towards women?
What does age-sex pyramid define?
What do you mean by an aging population?
What does the literacy rate of a country indicate?
How does the sex ratio give important information about the status of women in a country?
“In some countries of the world, the sex ratio is unfavourable to women.” Give one reason.
Which age group forms the working population?
“The shape of the population pyramid reflects the characteristics of the population.” Support the statement with examples.
What is life expectancy in India?
The literacy rate in India is ______.
Which one of the following is the largest group of India?
Which state has the lowest sex ratio?
A worker is known as main worker, who works atleast ____________.
Which one of the following reflected by Age-Sex pyramid?
How many types of Age-Sex Pyramid?
Bell shaped Pyramid refers to ______.
Narrow base of age-sex pyramid refers to ______.
Broad base of age-sex pyramid refers to ______.
The lowest sex ratio is found in ______.
The aging population has aged more than ______.
Expanding population pyranrd shows.
Which diagram shows age-sex structure?
Which of the following programs sponsored by the central government aims at enabling the rural population to conserve water for drinking, irrigation, fisheries and afforestation?
Population of India according to Occupation can be categorized into:
The largest country in Asia Continent in terms of area ______
Study the given graph carefully and answer the following question:
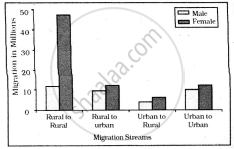
Intra-state Migration by place of Last Residence Indicating Migration Streams India, 2011
Inter-state Migration by Place of Last Residence Indicating Migration Streams India, 2011
What is the main cause of male migration from rural to urban?
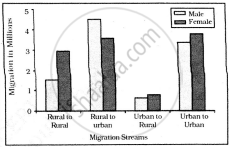
Study the given graph carefully and answer the following question:
Intra-state Migration by place of Last Residence Indicating Migration Streams India, 2011
Inter-state Migration by Place of Last Residence Indicating Migration Streams India, 2011
Who dominates rural to rural migration in inter-state migration?
Which of the following is true about natural advantage and social disadvantage?
Which of the following is a major concern of study about the population of a country?
The sex ratio in a country can be expressed as which of the following?
Which of the following is not a reason of unfavourable sex ratio against women?
What does the high proportion of young population implies?
Which group is also known as post-reproductive group?
Which type of population pyramid usually characterises developed countries where population growth is zero?
Arrange according to increase in age :
- Adults
- Children
- Old people
- Young people
"India is a land of linguistic diversity." Support the statement.
Which one of the following is the largest linguistic group of India?
Which one of the following is the largest linguistic group of India?
