Advertisements
Advertisements
Question
How is sex-ratio measured?
Solution
Sex ratio in the world is calculated as number of males per thousand of females in a population.
Sex ratio = (No. of males)/(No. of females) × 1000
In countries like India sex ratio is calculated as number of females per thousand of males.
Sex ratio = (No. of females)/(No. of males) × 1000
APPEARS IN
RELATED QUESTIONS
Identify the correct co-relation:
A: Assertion; R: Reasoning
A: Increase in the dependency ratio will affect the economy.
R: Medical costs are high when there are more elderly in the population.
Write a short note on literacy rate.
Give geographical reasons:
Literacy rate of a country is an indicator of its socio-economic development.
Differentiate between:
Expansive population pyramid and Constrictive population pyramid.
Answer in detail:
Explain the rural and urban population structure.
Ratio of males and females in the population is ______.
Complete the chain
| Sr. No. | A | B | C |
| 1. | Expansive age pyramid | Low birth-death rate | High medical expenses |
| 2. | Constrictive age pyramid | Human capital | Unwillingness |
| 3. | Stationery age pyramid | Low number of old people | Demographic dividend |
| 4. | High working population | Problem of subsistence | Developed country |
| 5. | Migration due to drought | High number of old people | Economically backward |
Identify the incorrect factor
Type of age-sex pyramid:
State whether right or wrong:
Literacy ratio of population is indicator of economic and social development of a country.
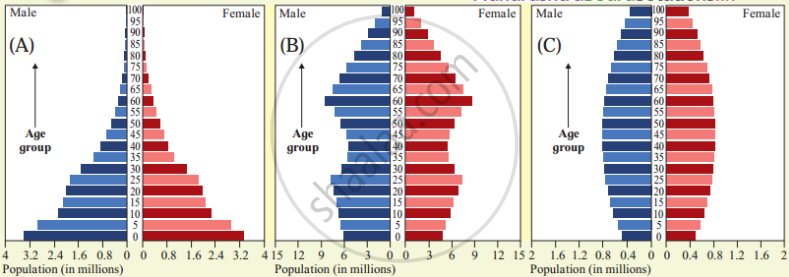
Observe the following graph and answer the question given below:

Questions:
- Which pyramid(s) represent(s) a country with high medical expenditure?
- Which pyramid(s) represent(s) a country with a large manpower?
- In which pyramid(s) the number of old people will be the least?
- What is the reason of the broad shape of A pyramid?
- Why C pyramid looks vertical in shape?
Observe the following graph and answer the question given below:

Question:
- Which type of the graph shown above?
- In which age group male percentage is highest?
- In which age group female percentage is lowest?
- Whose percentage is highest in 30-39 age group?
- In which age group female percentage is higher than male percentage?
Write short note
Occupational structure of India
Write short note
Rural-urban structure of population
Which one of the following states has the highest proportion of the urban population in India according to the 2001 Census?
‘The agricultural sector has the largest share of Indian workers.’ – Explain.
Give an account of the occupational structure of India’s population.
Which one of the following figures represents the working age group of the population?
What is the significance of age-structure?
Why is an unfavorable female sex ratio found in India and other South Asian countries?
What do you mean by natural advantage and social disadvantage?
What was the percentage of urban population in the world in 2011?
Which country has the lowest sex ratio in the world?
Why is the age structure considered an important indicator of population composition? Give one reason.
Which state has the highest % of the rural population?
Which state has the highest sex ratio?
How many Million Plus towns are there in India (in 2001)?
Which one of the following is the largest group of India?
Which one of the following country lowest sex ratio in the world?
Bell shaped Pyramid refers to ______.
Narrow base of age-sex pyramid refers to ______.
In how many countries, unfavourable sex ratio is found?
In which continent, low sex ratio is found?
Which diagram shows age-sex structure?
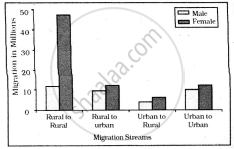
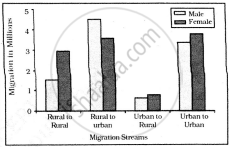
Study the given graph carefully and answer the following question:

Intra-state Migration by place of Last Residence Indicating Migration Streams India, 2011

Inter-state Migration by Place of Last Residence Indicating Migration Streams India, 2011
What is the main cause of male migration from rural to urban?
Table: India-Class-wise number of towns and cities and their population, 2011
| Class | Population Size | Number of Cities | Total Urban Population (in thousands) | % of Total Urban Population |
| I | 1,00,000 & more | 568 | 2,27,899 | 60-45 |
| II | 50,000-99,999 | 474 | 41,328 | 10-96 |
| III | 20,000-49,999 | 1,373 | 58,174 | 15-43 |
| IV | 10,000-19,999 | 1,683 | 31,866 | 8-45 |
| V | 5,000-9,999 | 1,749 | 15,883 | 4-21 |
| VI | less than 5,000 | 424 | 1,956 | 0-52 |
Source: Census of India-2011 and India 2017, Ministry of Information and Broadcasting, Government of India.
Which class town has the maximum urban population?
Study the given graph carefully and answer the following question:

Intra-state Migration by place of Last Residence Indicating Migration Streams India, 2011

Inter-state Migration by Place of Last Residence Indicating Migration Streams India, 2011
What is the main cause of female migration from rural to urban?
Study the given graph carefully and answer the following question:

Intra-state Migration by place of Last Residence Indicating Migration Streams India, 2011

Inter-state Migration by Place of Last Residence Indicating Migration Streams India, 2011
Who dominates rural to rural migration in intra-state migration?
The highest sex ratio is found in:
Which of the following is true about natural advantage and social disadvantage?
India's population as per the 2011 census is:
Identify the country with the highest sex-ratio in the world.
Which group is also known as post-reproductive group?
Which type of population pyramid shows a bell shape?
Mining is a ______.
Identify the correct group or factor.
Observe the following graph and answer the question given below.

- Which region has the highest literacy rate?
- Which region has the lowest literacy rate?
- In which region does women fare better than men in literacy rate?
- Write a concluding paragraph about the graph.
- What does this graph tells us?
"India is a land of linguistic diversity." Support the statement.
Which one of the following is the largest linguistic group of India?
Which one of the following is the largest linguistic group of India?
Draw a neat, labelled diagram
Pyramids of underdeveloping countries.
Which one of the following is the largest linguistic group of India?
