Advertisements
Advertisements
Question
What do you understand by population composition?
Solution
People of any country are diverse in many respects. Each person is unique in his own way. People can be distinguished by their age, sex and their place of residence. The entire gamut of people residing in a particular place along with their growth, distribution and variety may be termed as its population composition.
APPEARS IN
RELATED QUESTIONS
Give geographical reasons:
Literacy rate of a country is an indicator of its socio-economic development.
Complete the chain
| Sr. No. | A | B | C |
| 1. | Expansive age pyramid | Low birth-death rate | High medical expenses |
| 2. | Constrictive age pyramid | Human capital | Unwillingness |
| 3. | Stationery age pyramid | Low number of old people | Demographic dividend |
| 4. | High working population | Problem of subsistence | Developed country |
| 5. | Migration due to drought | High number of old people | Economically backward |
Give geographical reason
Demographic dividend increases when proportion of working population increases.
Identify the incorrect factor
Type of age-sex pyramid:
Identify the incorrect factor
Regions having sex ratio more than one thousand:
Identify the incorrect factor
Difference in population according to rural-urban structure:
Identify the incorrect factor
Factors having direct relation with literacy:
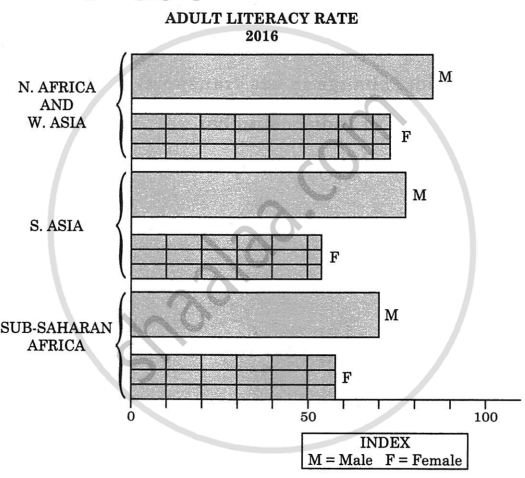
Observe the following graph and answer the question given below

Question:
- Which region has the highest literacy rate?
- Which region has the lowest literacy rate?
- In which region does women fare better than men in literacy rate?
- Write a concluding paragraph about the graph.
- Which is the type of graph?
Observe the following graph and answer the question given below:

Question:
- Which type of the graph shown above?
- In which age group male percentage is highest?
- In which age group female percentage is lowest?
- Whose percentage is highest in 30-39 age group?
- In which age group female percentage is higher than male percentage?
Write short note.
Literacy and education
Why do some states of India have higher rates of work participation than others?
Give an account of the occupational structure of India’s population.
Which one of the following countries has the highest sex ratio in the world?
How is sex-ratio measured?
Which regions have an unfavorable sex ratio towards women?
Which country has the highest sex ratio in the world?
Divide population based on the place of residence.
What does the literacy rate of a country indicate?
What do you mean by natural advantage and social disadvantage?
Which country has the lowest sex ratio in the world?
“In some countries of the world, the sex ratio is unfavourable to women.” Give one reason.
Where does India rank in the world as regards area?
How many Million Plus towns are there in India (in 2001)?
Which of the following is the largest religious minority in India?
The literacy rate in India is ______.
Which one of the following is the largest group of India?
How many types of Age-Sex Pyramid?
Triangular shaped Pyramid refers to ______.
Narrow base of age-sex pyramid refers to ______.
Broad base of age-sex pyramid refers to ______.
Which attribute does not distinguish people?
The lowest sex ratio is found in ______.
Expanding population pyranrd shows.
Which type of age-sex pyramid is of Australia?
Which diagram shows age-sex structure?
Which country’s population shows a constant population?
Which of the following pairs is not matched correctly?
The largest country in Asia Continent in terms of area ______
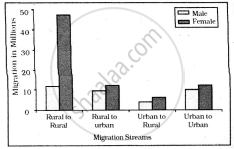
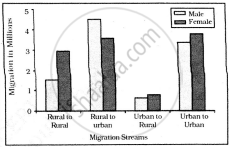
Study the given graph carefully and answer the following question:

Intra-state Migration by place of Last Residence Indicating Migration Streams India, 2011

Inter-state Migration by Place of Last Residence Indicating Migration Streams India, 2011
Which stream of migration shows the lowest trend in interstate migration?
Study the given graph carefully and answer the following question:

Intra-state Migration by place of Last Residence Indicating Migration Streams India, 2011

Inter-state Migration by Place of Last Residence Indicating Migration Streams India, 2011
Who dominates rural to rural migration in inter-state migration?
Study the given graph carefully and answer the following question:

Intra-state Migration by place of Last Residence Indicating Migration Streams India, 2011

Inter-state Migration by Place of Last Residence Indicating Migration Streams India, 2011
Which stream of migration shows the lowest trend in intra-state migration?
Study the given graph carefully and answer the following question:

Intra-state Migration by place of Last Residence Indicating Migration Streams India, 2011

Inter-state Migration by Place of Last Residence Indicating Migration Streams India, 2011
Who dominates rural to rural migration in intra-state migration?
From which of the following do we get information regarding the population of our country?
The sex ratio in a country can be expressed as which of the following?
Which type of population pyramid shows a bell shape?
Arrange the following States/UTs in descending order in terms of their percentage of urban population as per the Census 2011.
- Delhi
- Kerala
- Maharashtra
- Assam
A country having pyramid of population that has a wide base and sharply tapered top is characterised by which of the following?
Identify the correct group or factor.
Observe the following graph and answer the question given below.

- Which region has the highest literacy rate?
- Which region has the lowest literacy rate?
- In which region does women fare better than men in literacy rate?
- Write a concluding paragraph about the graph.
- What does this graph tells us?
Which one of the following is the largest linguistic group of India?
Which one of the following is the largest linguistic group of India?
Write a short note on:
Demographic dividend.
Which one of the following is the largest linguistic group of India?
Read the following graph and answer the questions given below:

Questions:
- Which region has a very less adult female literacy rate?
- Why the percentage of adult male literacy rate is more in the given regions?
- Why the percentage of female-male literacy rate in 2016 is less in sub-Saharan Africa?
- Write your own opinion about the adult female literacy rate with reference to the graph.
- With reference to graph which country would be advanced in social factors?
Which one of the following is the largest linguistic group of India?
