Advertisements
Advertisements
प्रश्न
Estimate the median, the lower quartile and the upper quartile of the following frequency distribution by drawing an ogive:
| Marks | 30-40 | 40-50 | 50-60 | 60-70 | 70-80 | 80-90 | 90-100 |
| No. of boys | 10 | 12 | 14 | 12 | 9 | 7 | 6 |
उत्तर
| Marks | No. of boys (f) | Cumulative Frequency |
| 30-40 | 10 | 10 |
| 40-50 | 12 | 22 |
| 50-60 | 14 | 36 |
| 60-70 | 12 | 48 |
| 70-80 | 9 | 57 |
| 80-90 | 7 | 64 |
| 90-100 | 6 | 70 |
Take a graph paper and draw both the axes.
On the x-axis, take a scale of 1cm = 20 to represent the marks.
On the y-axis , take a scale of 1 cm = 10 to represent the number of boys.
Now , plot the points (40,10),(50,22),(60,36),(70,48),(80,57),(90,64),(100,70)
Join them by a smooth curve to get the ogive.

No. of terms = 70
∴ Median = `(35+36)/2` = 35.5th term
Through mark of 35.5 on y-axis draw a line parallel to x-axis which meets the curve at A. From A, draw a perpendicular to x-axis which meets is at B.
The value of B is the median which is 60.
Lower Quartile (Q1) = `n/4 = 70/4` = 17.5th term
Through mark of 17.5 on y-axis draw a line parallel to x-axis which meets the curve at P. From P, draw a perpendicular to x-axis which meets it at Q.
The value of Q is the lower quartile which is 47.5.
Upper Quartile (Q3) = `(n xx 3)/4 = (70 xx 3)/4` = 52.5th term
Through mark of 52.5 on y-axis draw a line parallel to x-axis which meets the curve at R, draw a perpendicular to x-axis which meets it at S.
The value of S is the upper quartile which is 74.5.
APPEARS IN
संबंधित प्रश्न
Marks obtained by 40 students in a short assessment is given below, where a and b are two missing data.
| Marks | 5 | 6 | 7 | 8 | 9 |
| Number of Students | 6 | a | 16 | 13 | b |
If the mean of the distribution is 7.2, find a and b.
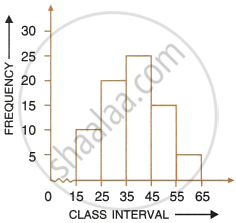
Using the information given in the adjoining histogram, calculate the mean.

Attempt this question on a graph paper. The table shows the distribution of marks gained by a group of 400 students in an examination.
|
Marks (Less than ) |
10 | 20 | 30 | 40 | 50 | 60 | 70 | 80 | 90 | 100 |
| No.of student | 5 | 10 | 30 | 60 | 105 | 180 | 270 | 355 | 390 | 400 |
Using scaie of 2cm to represent 10 marks and 2 cm to represent 50 student, plot these point and draw a smooth curve though the point
Estimate from the graph :
(1)the median marks
(2)the quartile marks.
A boy scored following marks in various class tests during a term; each test being marked out of 20.
15, 17, 16, 7, 10, 12, 14, 16, 19, 12 and 16
What are his median marks?
A boy scored following marks in various class tests during a term; each test being marked out of 20.
15, 17, 16, 7, 10, 12, 14, 16, 19, 12 and 16
What are his mean marks?
A mathematics aptitude test of 50 students was recored as follows:
| Marks | No. of students |
| 50-60 | 4 |
| 60-70 | 8 |
| 70-80 | 14 |
| 80-90 | 19 |
| 90-100 | 5 |
Draw a histrogram for the above data using a graph paper and locate the mode.
The weights of 11 students in a class are 36 kg, 45 kg, 44 kg, 37 kg, 36 kg, 41 kg, 45 kg, 43 kg, 39 kg, 42 kg and 40 kg. Find the median of their weights.
The frequency distribution table below shows the height of 50 students of grade 10.
| Heights (in cm) | 138 | 139 | 140 | 141 | 142 |
| Frequency | 6 | 11 | 16 | 10 | 7 |
Find the median, the upper quartile and the lower quartile of the heights.
Estimate the median, the lower quartile and the upper quartile of the following frequency distribution by drawing an ogive:
| Marks (less than) | 10 | 20 | 30 | 40 | 50 | 60 | 70 | 80 |
| No. of students | 5 | 15 | 30 | 54 | 72 | 86 | 94 | 100 |
Find the median of the given values : 47, 53, 62, 71, 83, 21, 43, 47, 41
