Advertisements
Advertisements
प्रश्न
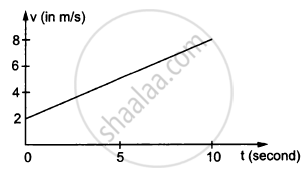
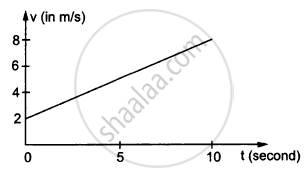
In the following figure Shows the graph of velocity versus time for a particle going along the X-axis. Find the acceleration
उत्तर
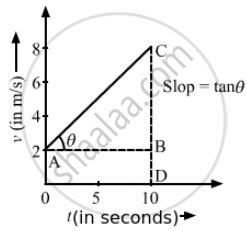
Slope of the v–t graph gives the acceleration.
Acceleration
APPEARS IN
संबंधित प्रश्न
The position-time (x-t) graphs for two children A and B returning from their school O to their homes P and Q respectively, are shown in the figure. Choose the correct entries in the brackets below;
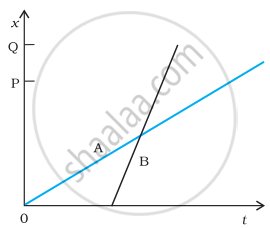
- (A/B) lives closer to the school than (B/A)
- (A/B) starts from the school earlier than (B/A)
- (A/B) walks faster than (B/A)
- A and B reach home at the (same/different) time
- (A/B) overtakes (B/A) on the road (once/twice).
A police van moving on a highway with a speed of 30 km h–1 fires a bullet at a thief’s car speeding away in the same direction with a speed of 192 km h–1. If the muzzle speed of the bullet is 150 m s–1, with what speed does the bullet hit the thief’s car? (Note: Obtain that speed which is relevant for damaging the thief’s car).
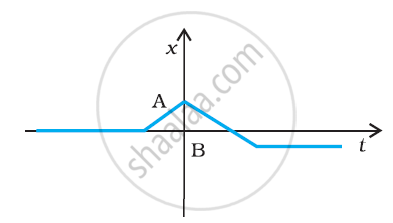
Suggest a suitable physical situation for the following graphs:
Two projectiles A and B are projected with angle of projection 15° for the projectile A and 45° for the projectile B. If RA and RB be the horizontal range for the two projectiles, then
A particle starts from the origin, goes along the X-axis to the point (20 m, 0) and then return along the same line to the point (−20 m, 0). Find the distance and displacement of the particle during the trip.
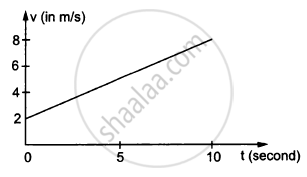
In the following figure Shows the graph of velocity versus time for a particle going along the X-axis. Find the distance travelled in 0 to 10s
In the following figure Shows the graph of velocity versus time for a particle going along the X-axis. Find the displacement in 0 to 10 s.
Refer to the graphs in figure. Match the following.
| Graph | Characteristic |
(a) 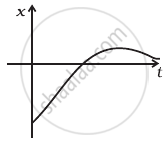 |
(i) has v > 0 and a < 0 throughout. |
(b) 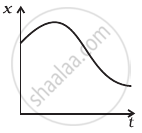 |
(ii) has x > 0 throughout and has a point with v = 0 and a point with a = 0. |
(c) 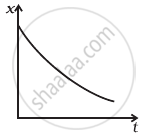 |
(iii) has a point with zero displacement for t > 0. |
(d) 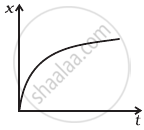 |
(iv) has v < 0 and a > 0. |
A ball is dropped and its displacement vs time graph is as shown figure (displacement x is from ground and all quantities are +ve upwards).
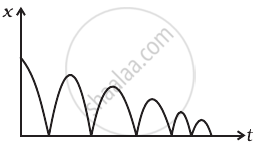
- Plot qualitatively velocity vs time graph.
- Plot qualitatively acceleration vs time graph.
A man runs across the roof-top of a tall building and jumps horizontally with the hope of landing on the roof of the next building which is of a lower height than the first. If his speed is 9 m/s, the (horizontal) distance between the two buildings is 10 m and the height difference is 9 m, will he be able to land on the next building? (take g = 10 m/s2)
The velocity-displacement graph of a particle is shown in figure.
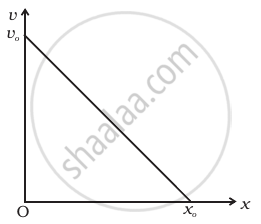
- Write the relation between v and x.
- Obtain the relation between acceleration and displacement and plot it.
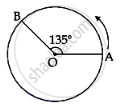
A person moved from A to B on a circular path as shown in figure. If the distance travelled by him is 60 m, then the magnitude of displacement would be: (Given cos135° = - 0.7)
A car covers the first half of the distance between two places at 40 km/h and other half at 60 km/h. The average speed of the car is ______.
