Advertisements
Advertisements
प्रश्न
Find the mean of the following frequency distribution by the short cut method :
| Class | 0-10 | 10-20 | 20-30 | 30-40 | 40-50 |
| Frequency | 9 | 12 | 15 | 10 | 14 |
उत्तर
| Class Interval | xi | fi | A = 25 d = x - A |
`f_i d` |
| 0-10 | 5 | 9 | -20 | -180 |
| 10-20 | 15 | 12 | -10 | -120 |
| 20-30 | A = 25 | 15 | 0 | 0 |
| 30-40 | 35 | 10 | 10 | 100 |
| 40-50 | 45 | 14 | 20 | 280 |
| Total | 60 | 80 |
`barx = A + (Σf_i d)/(Σf_i)`
`barx = 25 + 80/60`
`barx = 25 + 1.33`
`barx = 26.33`
`therefore` Mean = 26.33
APPEARS IN
संबंधित प्रश्न
1) Using step–deviation method, calculate the mean marks of the following distribution.
2) State the modal class.
| Class Interval | 50 - 55 | 55 - 60 | 60 - 65 | 65 - 70 | 70 - 75 | 75 - 80 | 80 - 85 | 85 – 90 |
| Frequency | 5 | 20 | 10 | 10 | 9 | 6 | 12 | 8 |
Find the mean of the following set of numbers:
6, 9, 11, 12 and 7
The following table gives the age of 50 student of a class. Find the arithmetic mean of their ages.
| Age-years | 16 – 18 | 18 – 20 | 20 – 22 | 22 – 24 | 24 – 26 |
| No. of students | 2 | 7 | 21 | 17 | 3 |
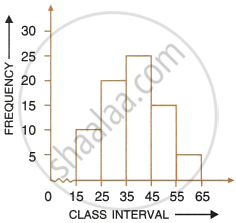
Using the information given in the adjoining histogram, calculate the mean.

The marks obtained by 120 students in a mathematics test is given below:
| Marks | No. of students |
| 0 – 10 | 5 |
| 10 – 20 | 9 |
| 20 – 30 | 16 |
| 30 – 40 | 22 |
| 40 – 50 | 26 |
| 50 – 60 | 18 |
| 60 – 70 | 11 |
| 70 – 80 | 6 |
| 80 – 90 | 4 |
| 90 – 100 | 3 |
Draw an ogive for the given distributions on a graph sheet. Use a suitable scale for your ogive. Use your ogive to estimate:
- the median
- the number of student who obtained more than 75% in test.
- the number of students who did not pass in the test if the pass percentage was 40.
- the lower quartile.
Find the mean of the following frequency distribution :
| class | 0-6 | 6-12 | 12-18 | 18-24 | 24-30 |
| Frequency | 7 | 5 | 10 | 12 | 6 |
Find the mean of the following frequency distribution by the short cut method :
| Class | 1-10 | 11-20 | 21-30 | 31-40 | 41-50 | 51-60 | 61-70 |
| Frequency | 7 | 10 | 14 | 17 | 15 | 11 | 6 |
Find the median of:
233, 173, 189, 208, 194, 204, 194, 185, 200 and 220.
The mean of a certain number of observations is 32. Find the resulting mean, if the observation is, increased by 3
In a given data, arranged in ascending or descending order, the middle most observation is called ______.
