Advertisements
Advertisements
प्रश्न
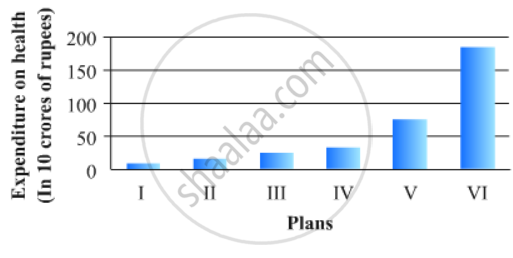
The expenditure (in 10 crores of rupees) on health by the Government of India during the various five year plans is shown below:
| Plans: | I | II | III | IV | V | VI |
| Expenditure on health (in 10 crores of rupees) |
7 | 14 | 23 | 34 | 76 | 182 |
Construct a bar graph to represent the above data.
उत्तर
To represent the given data by a vertical bar graph, we first draw horizontal and vertical axes. Let us consider that the horizontal and vertical axes representing the years and the expenditures on health in 10 crores of rupees respectively. We have to draw 6 bars of different lengths given in the table.
At first we mark 6 points in the horizontal axis at equal distances and erect rectangles of the same width at these points. The heights of the rectangles are proportional to the expenditures on health by the government of India in different years.
The vertical bar graph of the given data is following:
APPEARS IN
संबंधित प्रश्न
A survey conducted by an organisation for the cause of illness and death among the women between the ages 15 - 44 (in years) worldwide, found the following figures (in %):-
| S.No. | Causes | Female fatality rate (%) |
| 1. | Reproductive health conditions | 31.8 |
| 2. | Neuropsychiatric conditions | 25.4 |
| 3. | Injuries | 12.4 |
| 4. | Cardiovascular conditions | 4.3 |
| 5. | Respiratory conditions | 4.1 |
| 6. | Other causes | 22.0 |
- Represent the information given above graphically.
- Which condition is the major cause of women’s ill health and death worldwide?
- Try to find out, with the help of your teacher, any two factors which play a major role in the cause in (ii) above being the major cause.
Read the bar graph shown in Fig. 23.10 and answer the following questions
(i) What is the information given by the bar graph?
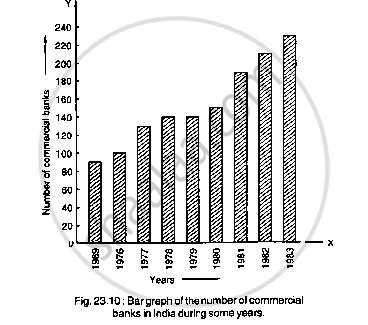
(ii) What was the number of commercial banks in 1977?
(iii) What is the ratio of the number of commercial banks in 1969 to that in 1980?
(iv) State whether true or false:
The number of commercial banks in 1983 is less than double the number of commercial banks in 1969.
Read the bar graph given in Fig. 23.19 and answer the following questions:
(i) What information is given by the bar graph?
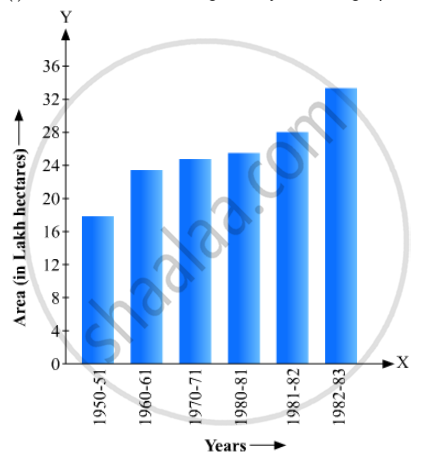
(ii) In which years the areas under the sugarcane crop were the maximum and the minimum?
(iii) State whether true or false:
The area under the sugarcane crop in the year 1982 - 83 is three times that of the year 1950 - 51
Read the bar graph given in Fig. 23.20 and answer the fol1owing questions:
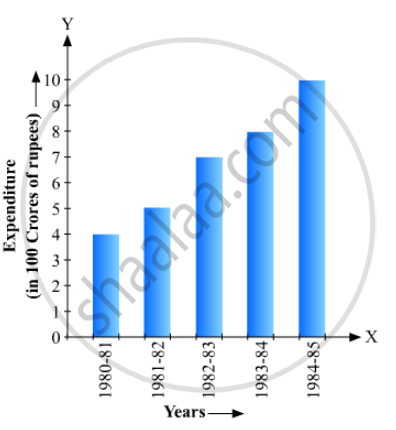
(i) What information is given by the bar graph?
(ii) What was the expenditure on health and family planning in the year 1982-83?
(iii) In which year is the increase in expenditure maximum over the expenditure in previous year? What is the maximum increase?
Read the bar graph given in Fig. 23.21 and answer the following questions:
(i) What is the information given by the bar graph?
(ii) What is the number of families having 6 members?
(iii) How many members per family are there in the maximum number of families? Also tell the number of such families.
(iv) What are the number of members per family for which the number of families are equal? Also, tell the number of such families?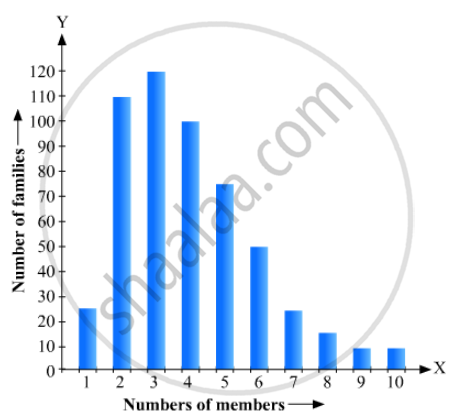
Read the following bar graph and answer the following questions:
(i) What information is given by the bar graph?
(ii) In which year the export is minimum?
(iii)In which year the import is maximum?
(iv)In which year the difference of the values of export and import is maximum?

In a histogram the area of each rectangle is proportional to
In the 'less than' type of ogive the cumulative frequency is plotted against
Draw frequency polygons for each of the following frequency distribution:
(a) using histogram
(b) without using histogram
|
C.I |
5 -15 | 15 -25 | 25 -35 | 35 - 45 | 45-55 | 55-65 |
| ƒ | 8 | 16 | 18 | 14 | 8 | 2 |
Expenditure on Education of a country during a five year period (2002-2006), in crores of rupees, is given below:
| Elementary education | 240 |
| Secondary Education | 120 |
| University Education | 190 |
| Teacher’s Training | 20 |
| Social Education | 10 |
| Other Educational Programmes | 115 |
| Cultural programmes | 25 |
| Technical Education | 125 |
Represent the information above by a bar graph.
