Advertisements
Advertisements
प्रश्न
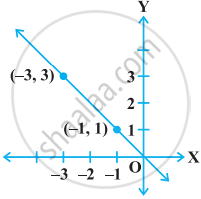
The graph given below represents the linear equation x + y = 0.

विकल्प
True
False
उत्तर
This statement is True.
Explanation:
The given equation is x + y = 0 that is y = –x.
Now, any point on the given graph has x and y-coordinate of opposite signs as, the point (–1, 1) and (–3, 3).
So, these points satisfy the given equation.
APPEARS IN
संबंधित प्रश्न
Draw the graph of the following linear equations in two variables:- 3 = 2x + y
If the point (2, -2) lies on the graph of the linear equation 5x + ky = 4, find the value of k.
Use graph paper for this question. Draw the graph of 2x - y - 1 = 0 and 2x + y = 9 on the same axes. Use 2 cm = 1 unit on both axes and plot only 3 points per line. Write down the coordinates of the point of intersection of the two lines.
Use graph paper for this question. Take 2 cm = 2 units on x-axis and 2 cm = 1 unit on y-axis.
Solve graphically the following equation:
3x + 5y = 12; 3x - 5y + 18 = 0 (Plot only three points per line)
Draw the graph for the following
y = `(3/2)x + 3`
Draw the graph for the following
3x + 2y = 14
Draw the graph of y = – 3x
Draw the graph of y = 2x + 5
The graph of every linear equation in two variables need not be a line.
The following observed values of x and y are thought to satisfy a linear equation. Write the linear equation:
| x | 6 | – 6 |
| y | –2 | 6 |
Draw the graph using the values of x, y as given in the above table. At what points the graph of the linear equation
- cuts the x-axis
- cuts the y-axis
