Advertisements
Advertisements
प्रश्न
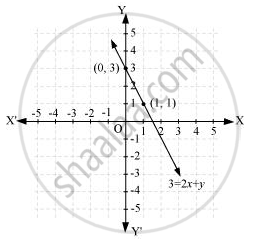
Draw the graph of the following linear equations in two variables:- 3 = 2x + y
उत्तर
It can be observed that x = 0, y = 3 and x = 1, y = 1 are solutions of the above equation. Therefore, the solution table is as follows.
| x | 0 | 1 |
| y | 3 | 1 |
The graph of this equation is constructed as follows.
APPEARS IN
संबंधित प्रश्न
Draw the graph of the equation given below. Also, find the coordinates of the point
where the graph cuts the coordinate axes : 6x − 3y = 12
Draw the graph for the equation, given below :
5x + y + 5 = 0
Draw the graph for the equation given below; hence find the co-ordinates of the points where the graph is drawn meets the co-ordinates axes:
`(2x + 15)/(3) = y - 1`
The graph of y = 6 is a line ______.
The graph of the linear equation x + 2y = 7 passes through the point (0, 7).
Every point on the graph of a linear equation in two variables does not represent a solution of the linear equation.
The graph of every linear equation in two variables need not be a line.
Draw the graphs of linear equations y = x and y = – x on the same cartesian plane. What do you observe?
If the point (3, 4) lies on the graph of 3y = ax + 7, then find the value of a.
Draw the graph of the linear equation 3x + 4y = 6. At what points, the graph cuts the x-axis and the y-axis.
