Advertisements
Advertisements
प्रश्न
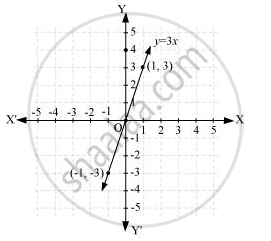
Draw the graph of the following linear equations in two variables:- y = 3x
उत्तर
It can be observed that x = −1, y = −3 and x = 1, y = 3 are solutions of the above equation. Therefore, the solution table is as follows.
| x | -1 | 1 |
| y | -3 | 3 |
The graph of the above equation is constructed as follows.
APPEARS IN
संबंधित प्रश्न
Draw the graph of the equation given below. Also, find the coordinate of the points
where the graph cuts the coordinate axes : 3x + 2y + 6 = 0
Draw the graph for the equation given below; hence find the co-ordinates of the points where the graph is drawn meets the co-ordinates axes:
`(1)/(3) x +(1)/(5) y = 1`.
Draw the graph of the equation 2x - 3y - 5 = 0
From the graph, find:
(i) x1, the value of x, when y = 7
(ii) x2, the value of x, when y = - 5.
Draw the graph obtained from the table below:
| X | a | 3 | - 5 | 5 | c | - 1 |
| Y | - 1 | 2 | b | 3 | 4 | 0 |
Use the graph to find the values of a, b and c. State a linear relation between the variables x and y.
Draw the graph of the equation
4x + 3y + 6 = 0
From the graph, find :
(i) y1, the value of y, when x = 12.
(ii) y2, the value of y, when x = - 6.
A straight line passes through the points (2, 4) and (5, - 2). Taking 1 cm = 1 unit; mark these points on a graph paper and draw the straight line through these points. If points (m, - 4) and (3, n) lie on the line drawn; find the values of m and n.
Use graph paper for this question. Take 2 cm = 1 unit on both the axes.
- Draw the graphs of x + y + 3 = 0 and 3x - 2y + 4 = 0. Plot only three points per line.
- Write down the coordinates of the point of intersection of the lines.
- Measure and record the distance of the point of intersection of the lines from the origin in cm.
Use the given table and draw the graph of a straight line.
| X | 1 | 2 | 3 | P |
| Y | 1 | q | -5 | 7 |
Find graphically the values of 'p' and 'q'.
Draw the graph of y = 2x + 5
Draw the graphs of linear equations y = x and y = – x on the same cartesian plane. What do you observe?
