Advertisements
Advertisements
Question
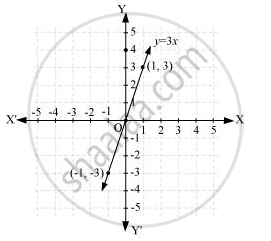
Draw the graph of the following linear equations in two variables:- y = 3x
Solution
It can be observed that x = −1, y = −3 and x = 1, y = 3 are solutions of the above equation. Therefore, the solution table is as follows.
| x | -1 | 1 |
| y | -3 | 3 |
The graph of the above equation is constructed as follows.
APPEARS IN
RELATED QUESTIONS
Draw the graph of y = | x | + 2.
Draw the graph for the equation, given below :
y + 7 = 0
Use the graphical method to find the value of k, if:
(5, k - 2) lies on the straight line x - 2y + 1 = 0
Solve, graphically, the following pairs of equation :
3x + 7y = 27
8 - y = `(5)/(2)x`
Solve, graphically, the following pairs of equations :
`(x + 1)/(4) = (2)/(3)(1 - 2y)`
`(2 + 5y)/(3) = x/(7) -2`
Use the given table and draw the graph of a straight line.
| X | 1 | 2 | 3 | P |
| Y | 1 | q | -5 | 7 |
Find graphically the values of 'p' and 'q'.
Draw the graph for the following
y = `(3/2)x + 3`
Draw the graph of the following equation:
x = – 7
The graph of y = 6 is a line ______.
The graph of the linear equation 2x + 3y = 6 is a line which meets the x-axis at the point ______.
