Advertisements
Advertisements
Question
Draw the graph of y = | x | + 2.
Solution
We have
y = | x | + 2 ............. (1)
Putting x = 0 , we get y = 2 ..............
Putting x = 1 , we get y = 3
Putting x = - 1 , we get y = 3
Thus, the we have the following table for the points on graph of | x | + 2
| x | 0 | 1 | 1 |
| y | 2 | 3 | 3 |
Graph of line equation y = | x | + 2

APPEARS IN
RELATED QUESTIONS
Draw the graph of the following linear equations in two variables:- y = 3x
If the point (3, 4) lies on the graph of the equation 3y = ax + 7, find the value of a.
From the choices given below, choose the equation whose graph is given in fig. below.
(i) y = x + 2 (ii) y = x – 2 (iii) y = −x + 2 (iv) x + 2y = 6
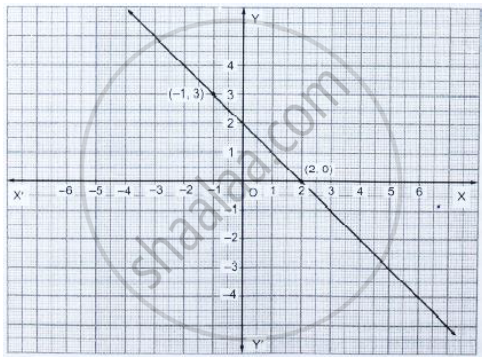
[Hint: Clearly, (2, 0) and (−1, 3) satisfy the equation y = −x + 2]
Draw the graph for the equation given below; hence find the co-ordinates of the points where the graph is drawn meets the co-ordinates axes:
`(1)/(3) x +(1)/(5) y = 1`.
Draw the graph obtained from the table below:
| X | a | 3 | - 5 | 5 | c | - 1 |
| Y | - 1 | 2 | b | 3 | 4 | 0 |
Use the graph to find the values of a, b and c. State a linear relation between the variables x and y.
Solve, graphically, the following pairs of equation :
2x + y = 23
4x - y = 19
Draw the graph of y = 2x + 5
Every point on the graph of a linear equation in two variables does not represent a solution of the linear equation.
Draw the graph of the linear equation whose solutions are represented by the points having the sum of the coordinates as 10 units.
The following observed values of x and y are thought to satisfy a linear equation. Write the linear equation:
| x | 6 | – 6 |
| y | –2 | 6 |
Draw the graph using the values of x, y as given in the above table. At what points the graph of the linear equation cuts the y-axis
