Advertisements
Advertisements
प्रश्न
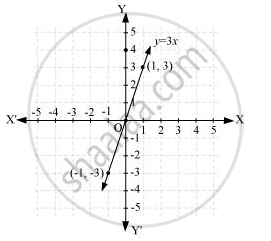
Draw the graph of the following linear equations in two variables:- y = 3x
उत्तर
It can be observed that x = −1, y = −3 and x = 1, y = 3 are solutions of the above equation. Therefore, the solution table is as follows.
| x | -1 | 1 |
| y | -3 | 3 |
The graph of the above equation is constructed as follows.
APPEARS IN
संबंधित प्रश्न
In countries like USA and Canada, temperature is measured in Fahrenheit, whereas in countries like India, it is measured in Celsius. Here is a linear equation that converts Fahrenheit to Celsius:-
`F=(9/5)C+32`
(i) Draw the graph of the linear equation above using Celsius for x-axis and Fahrenheit for y-axis.
(ii) If the temperature is 30°C, what is the temperature in Fahrenheit?
(iii) If the temperature is 95°F, what is the temperature in Celsius?
(iv) If the temperature is 0°C, what is the temperature in Fahrenheit and if the temperature is 0°F, what is the temperature in Celsius?
(v) Is there a temperature which is numerically the same in both Fahrenheit and Celsius? If yes, find it.
Plot the points (3, 5) and (− 1, 3) on a graph paper and verify that the straight line passing
through these points also passes through the point (1, 4).
From the choices given below, choose the equation whose graph is given in Fig. below.
(i) y = x (ii) x + y = 0 (iii) y = 2x (iv) 2 + 3y = 7x

[Hint: Clearly, (-1, 1) and (1, -1) satisfy the equation x + y = 0]
Draw the graph for the equation, given below :
x = 5
Draw the graph for the equation, given below :
2x + 3y = 0
Draw the graph for the equation, given below :
5x + y + 5 = 0
Draw the graph obtained from the table below:
| X | a | 3 | - 5 | 5 | c | - 1 |
| Y | - 1 | 2 | b | 3 | 4 | 0 |
Use the graph to find the values of a, b and c. State a linear relation between the variables x and y.
Use the graphical method to find the value of k, if:
(5, k - 2) lies on the straight line x - 2y + 1 = 0
The graph of y = 6 is a line ______.
Draw the graph of the equation represented by a straight line which is parallel to the x-axis and at a distance 3 units below it.
