Advertisements
Advertisements
प्रश्न
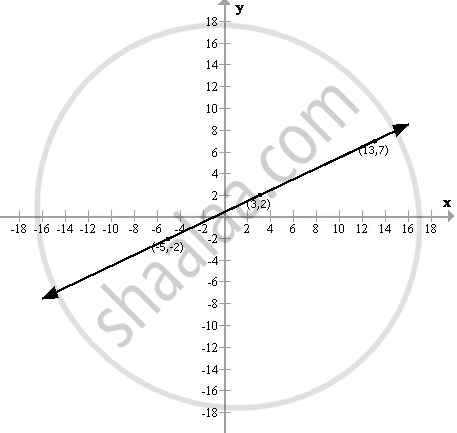
Use the table given below to draw the graph.
| X | - 5 | - 1 | 3 | b | 13 |
| Y | - 2 | a | 2 | 5 | 7 |
From your graph, find the values of 'a' and 'b'.
State a linear relationship between the variables x and y.
उत्तर
The table is:
| X | - 5 | - 1 | 3 | b | 13 |
| Y | - 2 | a | 2 | 5 | 7 |
Plotting the points as shown in the above table, we get the following required graph:

When x = - 1, then y = 0
⇒ a = 0
When y = 5, then x = 9
⇒ b = 9

Let y = px + q ....(1)
be a linear relation between x and y
Substitute x = 9 and y = 5 in the equation (1), we have,
5 = 9p + q ....(2)
Substitute x = - 1 and y = 0 in the equation (1), we have,
0 = - p + q ....(3)
Subtracting (3) from (2), we have,
5 = 10p
⇒ p = `(5)/(10)`
⇒ p = `(1)/(2)`
From (3), we have,
p = q
∴ q = `(1)/(2)`
Thus, the linear relation is
y = px + q
⇒ y = `(1)/(2) x+(1)/(2)`
⇒ y = `(x + 1)/(2)`
APPEARS IN
संबंधित प्रश्न
Draw the graph of the following linear equation in two variable : –x + y = 6
Draw the graph of the following linear equation in two variable : `(x-2)/3 = y - 3`
Draw the graph of the equation 2x - 3y - 5 = 0
From the graph, find:
(i) x1, the value of x, when y = 7
(ii) x2, the value of x, when y = - 5.
Solve, graphically, the following pairs of equations :
`(x + 1)/(4) = (2)/(3)(1 - 2y)`
`(2 + 5y)/(3) = x/(7) -2`
Use graph paper for this question. Take 2 cm = 2 units on x-axis and 2 cm = 1 unit on y-axis.
Solve graphically the following equation:
3x + 5y = 12; 3x - 5y + 18 = 0 (Plot only three points per line)
By drawing a graph for each of the equations 3x + y + 5 = 0; 3y - x = 5 and 2x + 5y = 1 on the same graph paper; show that the lines given by these equations are concurrent (i.e. they pass through the same point). Take 2 cm = 1 unit on both the axes.
Using a scale of 1 cm to 1 unit for both the axes, draw the graphs of the following equations: 6y = 5x + 10, y = 5x - 15.
From the graph find :
(i) the coordinates of the point where the two lines intersect;
(ii) the area of the triangle between the lines and the x-axis.
Draw the graph for the following
y = 2x
Draw the graph for the following
3x + 2y = 14
Draw the graph of the following equation:
x = – 7
