Advertisements
Advertisements
प्रश्न
Using graphic method, find the value of y when x = 48 from the following data:
| x | 40 | 50 | 60 | 70 |
| y | 6.2 | 7.2 | 9.1 | 12 |
उत्तर
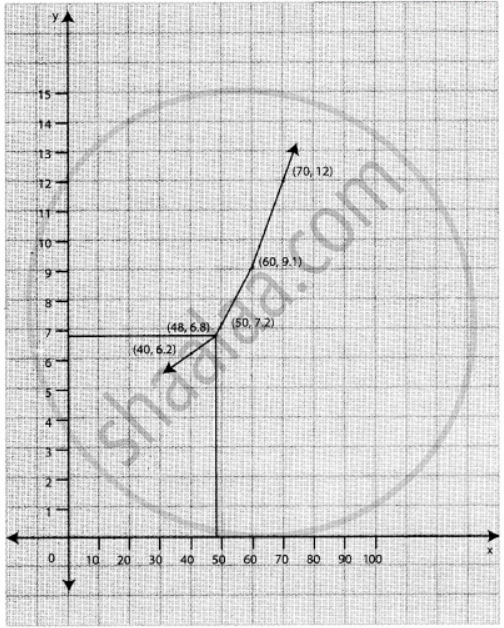
The value of y when x = 48 is 6.8
APPEARS IN
संबंधित प्रश्न
The population of a city in a censes taken once in 10 years is given below. Estimate the population in the year 1955.
| Year | 1951 | 1961 | 1971 | 1981 |
| Population in lakhs |
35 | 42 | 58 | 84 |
In an examination the number of candidates who secured marks between certain intervals was as follows:
| Marks | 0 - 19 | 20 - 39 | 40 - 59 | 60 - 79 | 80 - 99 |
| No. of candidates |
41 | 62 | 65 | 50 | 17 |
Estimate the number of candidates whose marks are less than 70.
Find the value of f(x) when x = 32 from the following table:
| x | 30 | 5 | 40 | 45 | 50 |
| f(x) | 15.9 | 14.9 | 14.1 | 13.3 | 12.5 |
Find f(2.8) from the following table:
| x | 0 | 1 | 2 | 3 |
| f(x) | 1 | 2 | 11 | 34 |
Using interpolation estimate the output of a factory in 1986 from the following data.
| Year | 1974 | 1978 | 1982 | 1990 |
| Output in 1000 tones |
25 | 60 | 80 | 170 |
Using interpolation estimate the business done in 1985 from the following data
| Year | 1982 | 1983 | 1984 | 1986 |
| Business done (in lakhs) |
150 | 235 | 365 | 525 |
Using interpolation, find the value of f(x) when x = 15
| x | 3 | 7 | 11 | 19 |
| f(x) | 42 | 43 | 47 | 60 |
Find the missing figures in the following table:
| x | 0 | 5 | 10 | 15 | 20 | 25 |
| y | 7 | 11 | - | 18 | - | 32 |
Find f(0.5) if f(– 1) = 202, f(0) = 175, f(1) = 82 and f(2) = 55
If u0 = 560, u1 = 556, u2 = 520, u4 = 385, show that u3 = 465
