Advertisements
Advertisements
प्रश्न
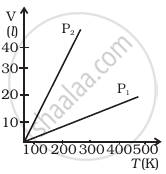
Volume versus temperature graphs for a given mass of an ideal gas are shown in figure at two different values of constant pressure. What can be inferred about relation between P1 and P2?

विकल्प
P1 > P2
P1 = P2
P1 < P2
data is insufficient.
उत्तर
P1 > P2
Explanation:
As we know that the pressure and the quantity of gas in the system are constants. Thus, by using the ideal gas equation
PV = nRT
V ∝ T .....(When n, P and R are constants)
`V_1/T_1` = constant
Or slope of graph is constant
`V = (nRT)/P`
`(dV)/(dT) = (nR)/P`
Or `(dV)/(dT)` increases when P decreases
Thus, `(dV)/(dT) ∝ 1/P`
This shows that slope P1 is smaller than P2.
APPEARS IN
संबंधित प्रश्न
Comment on the following statement: the temperature of all the molecules in a sample of a gas is the same.
Figure shows two vessels A and B with rigid walls containing ideal gases. The pressure, temperature and the volume are pA, TA, V in the vessel A and pB, TB, V in the vessel B. The vessels are now connected through a small tube. Show that the pressure p and the temperature T satisfy `Ρ/T = 1/2 ({P_A}/{T_A}+{P_B}/{T_B))` when equilibrium is achieved.

One mole of an ideal gas undergoes a process `P = (P_0)/(1+(V/V_0)^2` where `p_0` and `V_0` are constants . Find the temperature of the gas when `V=V_0` .
Using figure, find the boiling point of methyl alcohol at 1 atm (760 mm of mercury) and at 0.5 atm.

Earth’s mean temperature can be assumed to be 280 K. How will the curve of blackbody radiation look like for this temperature? Find out λmax. In which part of the electromagnetic spectrum, does this value lie? (Take Wien's constant b = 2.897 × 10⁻³ m K)
The power radiated by a perfect blackbody depends only on its ______
Above what temperature, all bodies radiate electromagnetic radiation?
The average translational kinetic energy of gas molecules depends on ____________.
Average kinetic energy of H2 molecule at 300K is 'E'. At the same temperature, average kinetic energy of O2 molecule will be ______.
For a particle moving in vertical circle, the total energy at different positions along the path ______.
