Advertisements
Advertisements
प्रश्न
Draw a histogram of the following data.
| Height of student (cm) | 135 - 140 | 140 - 145 | 145 - 150 | 150 - 155 |
| No. of students | 4 | 12 | 16 | 8 |
Advertisements
उत्तर

APPEARS IN
संबंधित प्रश्न
Given below is the frequency distribution of driving speeds (in km/hour) of the vehicles of 400 college students:
| Speed (in km/hr) | No. of Students |
| 20-30 | 6 |
| 30-40 | 80 |
| 40-50 | 156 |
| 50-60 | 98 |
60-70 |
60 |
Draw Histogram and hence the frequency polygon for the above data.
A Mathematics aptitude test of 50 students was recorded as follows:
| Marks | 50 - 60 | 60 - 70 | 70 - 80 | 80 - 90 | 90 – 100 |
| No. of Students | 4 | 8 | 14 | 19 | 5 |
Draw a histogram from the above data using a graph paper and locate the mode.
Draw histogram for the following frequency distributions:
| Class Interval | 10 – 16 | 16 – 22 | 22 – 28 | 28 – 34 | 34 – 40 |
| Frequency | 15 | 23 | 30 | 20 | 16 |
Find the correct answer from the alternatives given.
|
No. of trees planted by each student |
1 - 3 | 4 - 6 | 7 - 9 | 10 - 12 |
| No. of students | 7 | 8 | 6 | 4 |
The above data is to be shown by a frequency polygon. The coordinates of the points to show number of students in the class 4-6 are . . . .
The following table is based on the marks of the first term examination of 10th class students. Show the information by a histogram. Also, draw a frequency polygon with the help of the histogram.
| Class-mark of marks | 325 | 375 | 425 | 475 | 525 | 575 |
| No. of students | 25 | 35 | 45 | 40 | 32 | 20 |
Draw a histogram of the following data:
| Class interval: | 10−15 | 15−20 | 20−25 | 25−30 | 30−35 | 34−40 |
| Frequency: | 30 | 98 | 80 | 58 | 29 | 50 |
In a hypothetical sample of 20 people the amounts of money with them were found to be as follows:
114, 108, 100, 98, 101, 109, 117, 119, 126, 131, 136, 143, 156, 169, 182, 195, 207, 219, 235, 118.
Draw the histogram of the frequency distribution (taking one of the class intervals as 50 − 100).
The following histogram shows the number of literate females in the age group of 10 to 40 years in a town: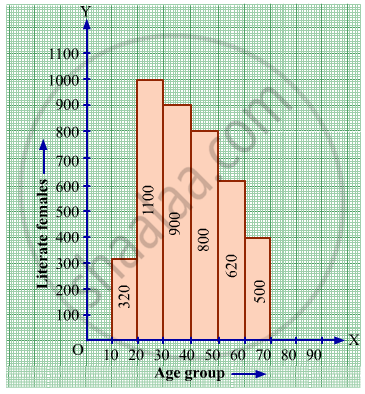
(i) Write the age group in which the number of literate female is the highest.
(ii) What is the class width?
(iii) What is the lowest frequency?
(iv) What are the class marks of the classes?
(v) In which age group literate females are the least?
Construct a frequency polygon without using a histogram for the following frequency distribution :
| Class Interval | 10-20 | 20-40 | 40-60 | 60-80 | 80-100 |
| Frequency | 9 | 17 | 15 | 20 | 14 |
Draw a histogram for the following frequency distribution.
|
Use of electricity (Unit)
|
50 - 70 | 70 - 90 | 90 - 110 | 110 - 130 | 130 - 150 | 150 - 170 |
| No. of families | 150 | 400 | 460 | 540 | 600 | 350 |
Distribution of height in cm of 100 people is given below:
| Class interval (cm) | Frequency |
| 145 - 155 | 3 |
| 155 - 165 | 35 |
| 165 - 175 | 25 |
| 175 - 185 | 15 |
| 185 - 195 | 20 |
| 195 - 205 | 2 |
Draw a histogram to represent the above data.
The time taken, in seconds, to solve a problem for each of 25 persons is as follows:
| 16 | 20 | 26 | 27 | 28 |
| 30 | 33 | 37 | 38 | 40 |
| 42 | 43 | 46 | 46 | 47 |
| 48 | 49 | 50 | 53 | 58 |
| 59 | 60 | 64 | 52 | 20 |
(i) Construct a frequency distribution for these data using a class interval of 10 seconds.
(ii) In a school the weekly pocket money of 50 students is as follow's:
| Weekly pocket money (₹) | No. of student |
| 40 - 50 | 2 |
| 59 - 60 | 8 |
| 60 - 70 | 12 |
| 70 - 80 | 14 |
| 80 - 90 | 8 |
| 90 - 100 | 6 |
Draw a histogram and a frequency polygon on the same graph. Find mode from the graph.
Draw a histogram and frequency polygon to represent the following data (on the same scale) which shows the monthly cost of living index of a city in a period of 2 years:
| Cost of living Index | Number of months |
| 440 - 460 | 2 |
| 460 - 480 | 4 |
| 480 - 500 | 3 |
| 500 - 520 | 5 |
| 520 - 540 | 3 |
| 540 - 560 | 2 |
| 560 - 580 | 1 |
| 580 - 600 | 4 |
| Total | 24 |
(Use a graph paper for this question.) The daily pocket expenses of 200 students in a school are given below:
| Pocket expenses (in ₹) |
Number of students (frequency) |
| 0 - 5 | 10 |
| 5 - 10 | 14 |
| 10 - 15 | 28 |
| 15 - 20 | 42 |
| 20 - 25 | 50 |
| 25 - 30 | 30 |
| 30 - 35 | 14 |
| 35 - 40 | 12 |
Draw a histogram representing the above distribution and estimate the mode from the graph.
A graph that displays data that changes continuously over the periods of time is _________
Draw a histogram for the following data.
| Mid Value (x) | 15 | 25 | 35 | 45 | 55 | 65 | 75 |
| Frequency (f) | 12 | 24 | 30 | 18 | 26 | 10 | 8 |
Try yourself
- Next time when you watch your favourite TV programme, count the number of advertisements during each break. Use tally marks. Put a dot below the tally when you find children in any advertisement.
- Compare with your friends. Do you get different answers?
Draw a histogram for the following data.
| Class interval | 10 – 15 | 15 – 20 | 20 – 25 | 25 – 30 | 30 – 35 | 35 – 40 |
| Frequency | 30 | 98 | 80 | 58 | 29 | 50 |
Show the following data by a frequency polygon:
| Electricity bill (₹) | Families |
| 200 – 400 | 240 |
| 400 – 600 | 300 |
| 600 – 800 | 450 |
| 800 – 1000 | 350 |
| 1000 – 1200 | 160 |
