Advertisements
Advertisements
प्रश्न
The marks obtained by 100 students of a class in an examination are given below.
| Mark | No. of Student |
| 0 - 5 | 2 |
| 5 - 10 | 5 |
| 10 - 15 | 6 |
| 15 - 20 | 8 |
| 20 - 25 | 10 |
| 25 - 30 | 25 |
| 30 - 35 | 20 |
| 35 - 40 | 18 |
| 40 - 45 | 4 |
| 45 - 50 | 2 |
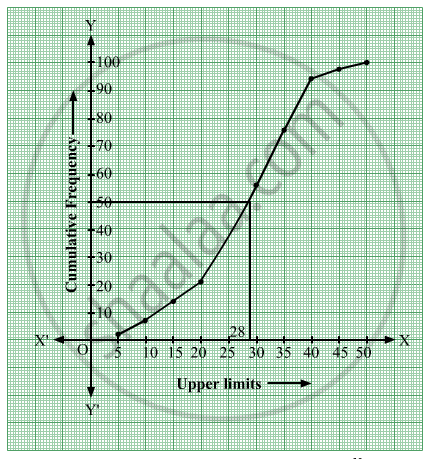
Draw 'a less than' type cumulative frequency curves (ogive). Hence find the median.
उत्तर
We first prepare the cumulative frequency table by less than method as given below–
| Marks | No. of students | Marks less than | Cumulative Frequency |
| 0 - 5 | 2 | 5 | 2 |
| 5 - 10 | 5 | 10 | 7 |
| 10 - 15 | 6 | 15 | 13 |
| 15 - 20 | 8 | 20 | 21 |
| 20 - 25 | 10 | 25 | 31 |
| 25 - 30 | 25 | 30 | 56 |
| 30 - 35 | 20 | 35 | 76 |
| 35 - 40 | 18 | 40 | 94 |
| 40 - 45 | 4 | 45 | 98 |
| 45 - 50 | 2 | 50 | 100 |
Thus we will plot the points (5, 2), (10, 7), (15, 13), (20, 21), (25, 31), (30, 56), (35, 76), (40, 94), (45, 98) and (50, 100).

∴ From the above ogive, the horizontal line drawn from `("N")/(2)=50` intersects the ogive at a point whose x-coordinate is approximately 28.
∴ Hence, Median≈">≈28.
APPEARS IN
संबंधित प्रश्न
During the medical check-up of 35 students of a class, their weights were recorded as follows:
| Weight (in kg | Number of students |
| Less than 38 | 0 |
| Less than 40 | 3 |
| Less than 42 | 5 |
| Less than 44 | 9 |
| Less than 46 | 14 |
| Less than 48 | 28 |
| Less than 50 | 32 |
| Less than 52 | 35 |
Draw a less than type ogive for the given data. Hence obtain the median weight from the graph verify the result by using the formula.
Draw a ‘more than’ ogive for the data given below which gives the marks of 100 students.
| Marks | 0 – 10 | 10 – 20 | 20 – 30 | 30 - 40 | 40 – 50 | 50 – 60 | 60 – 70 | 70 – 80 |
| No of Students | 4 | 6 | 10 | 10 | 25 | 22 | 18 | 5 |
The following is the cumulative frequency distribution ( of less than type ) of 1000 persons each of age 20 years and above . Determine the mean age .
| Age below (in years): | 30 | 40 | 50 | 60 | 70 | 80 |
| Number of persons : | 100 | 220 | 350 | 750 | 950 | 1000 |
Write the modal class for the following frequency distribution:
| Class-interval: | 10−15 | 15−20 | 20−25 | 25−30 | 30−35 | 35−40 |
| Frequency: | 30 | 35 | 75 | 40 | 30 | 15 |
Write the median class for the following frequency distribution:
| Class-interval: | 0−10 | 10−20 | 20−30 | 30−40 | 40−50 | 50−60 | 60−70 | 70−80 |
| Frequency: | 5 | 8 | 7 | 12 | 28 | 20 | 10 | 10 |
The mode of a frequency distribution can be determined graphically from ______.
If \[u_i = \frac{x_i - 25}{10}, \Sigma f_i u_i = 20, \Sigma f_i = 100, \text { then }\]`overlineX`
Find the mode of the following frequency distribution.
| Class | 0-10 | 10-20 | 20-30 | 30-40 | 40-50 | 50-60 | 60-70 |
| Frequency | 8 | 10 | 10 | 16 | 12 | 6 | 7 |
For one term, absentee record of students is given below. If mean is 15.5, then the missing frequencies x and y are.
| Number of days | 0 - 5 | 5 - 10 | 10 - 15 | 15 - 20 | 20 - 25 | 25 - 30 | 30 - 35 | 35 - 40 | TOTAL |
| Total Number of students | 15 | 16 | x | 8 | y | 8 | 6 | 4 | 70 |
The following are the ages of 300 patients getting medical treatment in a hospital on a particular day:
| Age (in years) | 10 – 20 | 20 – 30 | 30 – 40 | 40 – 50 | 50 – 60 | 60 – 70 |
| Number of patients | 60 | 42 | 55 | 70 | 53 | 20 |
Form: Less than type cumulative frequency distribution.
