Advertisements
Advertisements
Question
Find the median of the following frequency distribution:
| Class: | 0 – 20 | 20 – 40 | 40 – 60 | 60 – 80 | 80 – 100 |
| Frequency: | 6 | 8 | 5 | 9 | 7 |
Solution
| Class Interval | Frequency | Cumulative frequency (cf) |
| 0 – 20 | 6 | 6 |
| 20 – 40 | 8 | 14 |
| 40 – 60 | 5 | 19 |
| 60 – 80 | 9 | 28 |
| 80 – 100 | 7 | 35 |
| N = `sumf_i` = 35 |
Here, N = 35
⇒ `"N"/2 = 35/2`
So, Median class is 40 – 60
Lower limit of median class (l) = 40
Class width (h) = 20
Frequency of median class (f) = 5
Precceding cf of median class (`"C"_f`) = 14
∴ Median = `l + ((N/2 - "C"_f)/f) xx h`
= `40 + ((35/2 - 14)/5) xx 20`
= 40 + 7 × 2
= 54
APPEARS IN
RELATED QUESTIONS
A life insurance agent found the following data for distribution of ages of 100 policy holders. Calculate the median age, if policies are given only to persons having age 18 years onwards but less than 60 years.
| Age (in years) | Number of policy holders |
| Below 20 | 2 |
| 20 - 25 | 4 |
| 25 - 30 | 18 |
| 30 - 35 | 21 |
| 35 - 40 | 33 |
| 40 - 45 | 11 |
| 45 - 50 | 3 |
| 50 - 55 | 6 |
| 55 - 60 | 2 |
Following are the lives in hours of 15 pieces of the components of aircraft engine. Find the median:
715, 724, 725, 710, 729, 745, 694, 699, 696, 712, 734, 728, 716, 705, 719.
The weight of 60 boys are given in the following distribution table:
| Weight (kg) | 37 | 38 | 39 | 40 | 41 |
| No. of boys | 10 | 14 | 18 | 12 | 6 |
Find:
- Median
- Lower quartile
- Upper quartile
- Inter-quartile range
The following table shows the information regarding the milk collected from farmers on a milk collection centre and the content of fat in the milk, measured by a lactometer. Find the mode of fat content.
| Content of fat (%) | 2 - 3 | 3 - 4 | 4 - 5 | 5 - 6 | 6 - 7 |
| Milk collected (Litre) | 30 | 70 | 80 | 60 | 20 |
Find the correct answer from the alternatives given.
| Distance Covered per litre (km) | 12 - 14 | 14 - 16 | 16 - 18 | 18 - 20 |
| No. of cars | 11 | 12 | 20 | 7 |
The median of the distances covered per litre shown in the above data is in the group . . . . . .
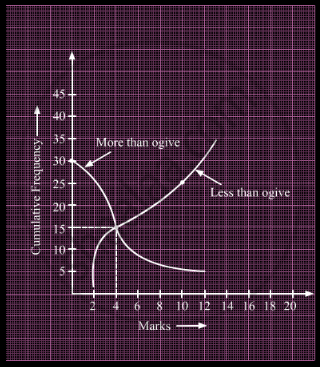
What is the value of the median of the data using the graph in the following figure of less than ogive and more than ogive?

In the following table, Σf = 200 and mean = 73. Find the missing frequencies f1, and f2.
| x | 0 | 50 | 100 | 150 | 200 | 250 |
| f | 46 | f1 | f2 | 25 | 10 | 5 |
Find the median of:
66, 98, 54, 92, 87, 63, 72.
If 35 is removed from the data, 30, 34, 35, 36, 37, 38, 39, 40 then the median increases by ______.
A life insurance agent found the following data for distribution of ages of 100 policy holders. Calculate the median age, if policies are given only to persons having age 18 years onwards but less than 60 year.
| Age (in years) | Number of policy holders |
| Below 20 | 2 |
| Below 25 | 6 |
| Below 30 | 24 |
| Below 35 | 45 |
| Below 40 | 78 |
| Below 45 | 89 |
| Below 50 | 92 |
| Below 55 | 98 |
| Below 60 | 100 |
