Advertisements
Advertisements
Questions
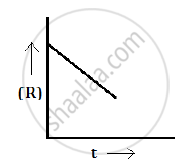
For a chemical reaction R → P, the variation in the concentration (R) vs. time (t) plot is given as:
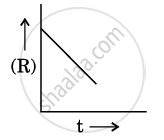
(i) Predict the order of the reaction.
(ii) What is the slope of the curve ?
(iii) Write the unit of rate constant for this reaction.
(iii) Write the unit of rate constant for this reaction.
Solution 1
For a chemical reaction R→P, the variation in the concentration (R) vs. time (t) plot is given as follows:
(i) The order of the reaction zero.
(ii) Slope = -k
Solution 2
(i) The variation in the concentration (R) vs. time (t) plot shown here represents a zero order reaction, for which the rate of the reaction is proportional to zero power of the concentration of the reactants.
(ii) For a zero order reaction, rate constant is given as
`k=([R]_0-[R])/t`
So, the slope of the curve for the variation in the concentration (R) vs. time (t) plot is equal to the negative of the rate constant for the reaction.
Solution 3
(iii) Since it is a first order reaction, the unit of the rate constant is s−1.
APPEARS IN
RELATED QUESTIONS
For a reaction A + B ⟶ P, the rate is given by
Rate = k [A] [B]2
How is the rate of reaction affected if the concentration of B is doubled?
Write resonating structures of ozone.
Define the following terms:
Half-life period of reaction (t1/2).
For which type of reactions, order and molecularity have the same value?
Why can we not determine the order of a reaction by taking into consideration the balanced chemical equation?
The role of a catalyst is to change
For a reaction \[\ce{Cl2l(g) + 2No(g) -> 2NaCl(g)}\] the rate law is expressed as rate= K[Cl2] [No]2 what is the order of the reaction?
At concentration of 0.1 and 0.2 mol L–1 the rates of deem position of a compound were found to be 0.18 and 0.72 mol L–1 m–1. What is the order of the reaction?
The conversion of molecules A to B follow second order kinetics. If concentration of A is increased to three times, how will it affect the rate of formation of B?
Which of the following statement is true?
