Advertisements
Advertisements
Question
The following is the distribution of weights (in kg) of 52 persons:
| Weight in kg | Persons |
| 30-40 | 10 |
| 40-50 | 15 |
| 50-60 | 17 |
| 60-70 | 6 |
| 70-80 | 4 |
(i) What is the lower limit of class 50-60?
(ii) Find the class marks of the classes 40-50, 50-60.
(iii) What is the class size?
Solution
(i) The lower limit of the class 50\[-\]60 is 50.
(ii) Class mark for the class 40\[-\]50:
\[\frac{40 + 50}{2}\]
\[ = \frac{90}{2}\]
\[ = 45\]
Again, class mark for the class 50 \[-\] 60:
\[ = \frac{110}{2}\]
\[ = 55\]
APPEARS IN
RELATED QUESTIONS
Define the following term:
Frequency of an observation
Define the following term:
True class limits
Construct a frequency table with equal class intervals from the following data on the monthly wages (in rupees) of 28 labourers working in a factory, taking one of the class intervals as 210-230 (230 not included):
220, 268, 258, 242, 210, 268, 272, 242, 311, 290, 300, 320, 319, 304, 302, 318, 306, 292, 254, 278, 210, 240, 280, 316, 306, 215, 256, 236.
The daily minimum temperatures in degrees Celsius recorded in a certain Arctic region are as follows:
−12.5, −10.8, −18.6, −8.4, −10.8, −4.2, −4.8, −6.7, −13.2, −11.8, −2.3, 1.2, 2.6, 0, −2.4, 0, 3.2, 2.7, 3.4, 0, −2.4, −2.4, 0, 3.2, 2.7, 3.4, 0, −2.4, −5.8, −8.9, −14.6, −12.3, −11.5, −7.8, −2.9
Represent them as frequency distribution table taking − 19.9 to − 15 as the first class interval.
The data that can take values between a certain range is called ________
The following list tells colours liked by 25 students. Prepare a table using Tally Marks.
| Red | Blue | White | Grey | White |
| Green | Grey | Blue | Green | Grey |
| Blue | Grey | Red | Green | Red |
| Blue | Blue | Green | Blue | Green |
| Grey | Grey | Green | Grey | Red |
Sumita stood on the road for half an hour and counted the number of vehicles passing by. She made a tally mark for each vehicle. This helped her in counting the total number of vehicles in each group.
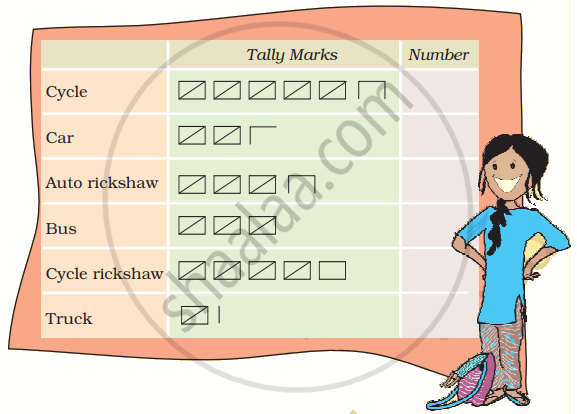
- Write the number of each vehicle in the table.
- How many vehicles in all did Sumita see on the road in half an hour?
- Auto rickshaws are thrice the number of trucks — true/false?
- Make tally marks for 7 more buses and 2 more trucks.
Fill in the blanks in the following table which represents shirt size of 40 students of a school.
| Shirt size | Tally Marks | Number of students |
| 30 | ||| | 3 |
| 32 | `cancel(bb|bb|bb|bb|)` | ______ |
| 34 | ______ | 8 |
| 36 | `cancel(bb|bb|bb|bb|)` || | ______ |
| 38 | `cancel(bb|bb|bb|bb|)` ______ | 10 |
| 40 | ______ | 7 |
| Number of two wheelers |
Tally marks | Number of families |
| 0 | ||| | 3 |
| 1 | `cancel(|bb|bb|bb|)` `cancel(|bb|bb|bb|)` `cancel(|bb|bb|bb|)` `cancel(|bb|bb|bb|)` `cancel(|bb|bb|bb|)` ||| | 28 |
| 2 | `cancel(|bb|bb|bb|)` `cancel(|bb|bb|bb|)` |||| | 14 |
| 3 | |||| | 4 |
| 4 | | | 1 |
| Total | 50 |
Prepare a bar graph of the data.
Following is the choice of sweets for 30 students of Class VI.
| Ladoo, Barfi, Ladoo, Jalebi, Ladoo, Rasgulla, Jalebi, Ladoo, Barfi, Rasgulla, Ladoo, Jalebi, Jalebi, Rasgulla, Ladoo, Rasgulla, Jalebi, Ladoo, Rasgulla, Ladoo, Ladoo, Barfi, Rasgulla, Rasgulla, Jalebi, Rasgulla, Ladoo, Rasgulla, Jalebi, Ladoo. |
Arrange the names of sweets in a table using tally marks.
