Advertisements
Advertisements
Question
The following table gives production yield in kg per hectare of wheat of 100 farms of a village :
| Production yield (kg/hectare) : |
40−45 | 45−50 | 50−55 | 55−60 | 60−65 | 65−70 |
| Number of farms | 4 | 6 | 16 | 20 | 30 | 24 |
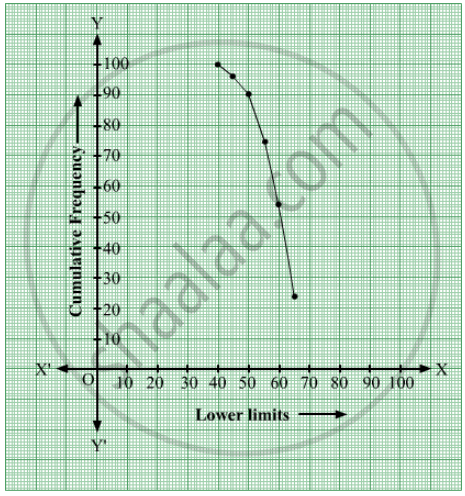
Change the distribution to a 'more than type' distribution, and draw its ogive.
Solution
| Production yield | Cumulative frequency |
| more than 40 | 100 |
| more than 45 | 96 |
| more than 50 | 90 |
| more than 55 | 74 |
| more than 60 | 54 |
| more than 65 | 24 |
RELATED QUESTIONS
The following distribution gives the daily income of 50 workers of a factory.
| Daily income (in ₹) | 200-220 | 220-240 | 240-260 | 260-280 | 280-300 |
| Number of workers | 12 | 14 | 8 | 6 | 10 |
Convert the distribution above to a 'less than type' cumulative frequency distribution and draw its ogive.
Draw the graph for the linear equation given below:
x = 3
Draw the graph for the linear equation given below:
y = 4
Draw the graph for the linear equation given below:
4x - y = 0
Draw the graph for the linear equation given below:
y = 2x + 3
Draw the graph for the equation given below:
`(2x - 1)/(3) - (y - 2)/(5) = 0`
For the pair of linear equations given below, draw graphs and then state, whether the lines drawn are parallel or perpendicular to each other.
3x + 4y = 24
`x/(4) + y/(3) = 1`
Draw a graph of each of the following equations: x + y - 3 = 0
Draw a graph of each of the following equations: x = -3y
Draw a graph of each of the following equations: y = `(3)/(5) x - 1`
