Advertisements
Advertisements
Question
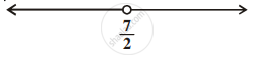
The inequality representing the following graph is ______.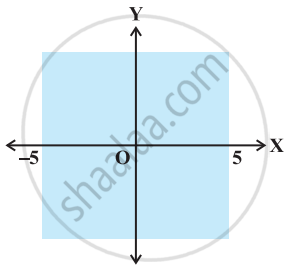
Options
|x| < 5
|x| ≤ 5
|x| > 5
|x| ≥ 5
Solution
The inequality representing the following graph is |x| < 5.
Explanation:
The given graph represents x > –5 and x < 5.
Combining the two inequalities |x| < 5.
APPEARS IN
RELATED QUESTIONS
Solve 24x < 100, when x is an integer.
Solve –12x > 30, when x is an integer.
Solve 5x – 3 < 7, when x is a real number.
Solve 3x + 8 > 2, when x is an integer.
Solve 3x + 8 > 2, when x is a real number.
Solve the given inequality for real x: 3(x – 1) ≤ 2 (x – 3)
Solve the given inequality for real x: x + `x/2` + `x/3` < 11
Solve the given inequality for real x: `1/2 ((3x)/5 + 4) >= 1/3 (x -6)`
Solve the given inequality for real x: 2(2x + 3) – 10 < 6 (x – 2)
Solve the given inequality for real x: `x/4 < (5x - 2)/3 - (7x - 3)/5`
Solve the given inequality for real x: `((2x- 1))/3 >= ((3x - 2))/4 - ((2 - x))/5`
Solve the given inequality and show the graph of the solution on number line:
3(1 – x) < 2 (x + 4)
Solve the given inequality and show the graph of the solution on number line:
`x/2 >= ((5x -2))/3 - ((7x - 3))/5`
Find all pairs of consecutive even positive integers, both of which are larger than 5 such that their sum is less than 23.
Solve the inequality.
6 ≤ –3(2x – 4) < 12
Solve the inequality.
`-3 <= 4 - (7x)/2 <= 18`
Solve the inequality.
`-12 < 4 - (3x)/(-5) <= 2`
Represent to solution set of each of the following inequations graphically in two dimensional plane:
x + 2y − y ≤ 0
Represent to solution set of each of the following inequations graphically in two dimensional plane:
4. x − 2y < 0
Represent to solution set of each of the following inequations graphically in two dimensional plane:
3y ≥ 6 − 2x
Solutions of the inequalities comprising a system in variable x are represented on number lines as given below, then ______.![]()
State whether the following statement is True or False.
If x > y and b < 0, then bx < by
State whether the following statement is True or False.
If xy > 0, then x > 0, and y < 0
State whether the following statement is True or False.
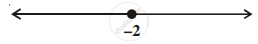
Graph of x > –2 is
Solution of a linear inequality in variable x is represented on number line given below ______.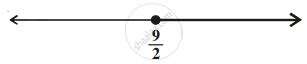
Solution of a linear inequality in variable x is represented on number line given below ______.
Solution of a linear inequality in variable x is represented on number line given below ______.