Advertisements
Advertisements
प्रश्न
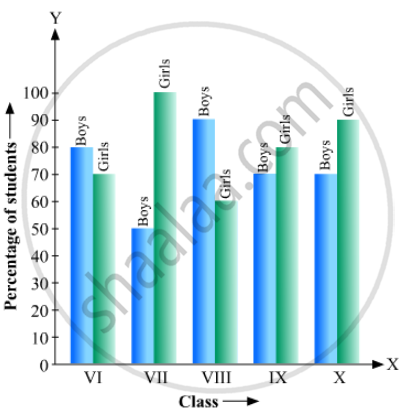
The following bar graph shows the results of an annual examination in a secondary school. Read the bar graph and choose the correct alternative in each of the following:

(i) The pair of classes in which the results of boys and girls are inversely proportional are:
(a) VI, VIII (b) VI, IX (c) VIII, IX (d) VIII, X
(ii) The class having the lowest failure rate of girls is
(a) VII (b) X (c) IX (d) VIII
(iii)The class having the lowest pass rate of students is
(a) VI (b) VII (c) VIII (d) IX
उत्तर
(1) The pair of classes in which the results of boys and girls are inversely proportional are VI and IX. So, (b) is the correct option.
(2) Lowest failure rate of girls is same to the highest pass rate. Hence, the class having the lowest failure rate of girls is VII (the height of the bar corresponding to girls for this class is maximum). So, the correct option is (a)
(3) The sum of the heights of the bars for boys and girls in the class VII is minimum, which is 95 + 40 = 135. Hence, the class having the lowest pass rate is VII.
Hence, the correct choice is (b).
APPEARS IN
संबंधित प्रश्न
The following table gives the life times of 400 neon lamps:-
| Life time (in hours) | Number of lamps |
| 300 - 400 | 14 |
| 400 - 500 | 56 |
| 500 - 600 | 60 |
| 600 - 700 | 86 |
| 700 - 800 | 74 |
| 800 - 900 | 62 |
| 900 - 1000 | 48 |
- Represent the given information with the help of a histogram.
- How many lamps have a life time of more than 700 hours?
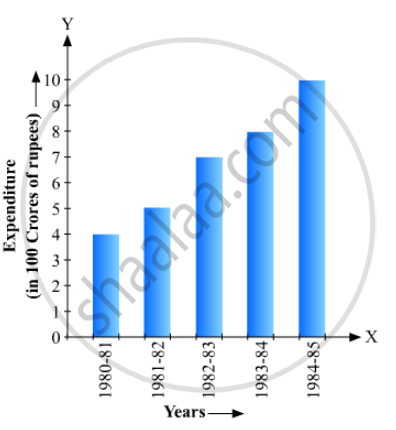
Read the bar graph given in Fig. 23.20 and answer the fol1owing questions:

(i) What information is given by the bar graph?
(ii) What was the expenditure on health and family planning in the year 1982-83?
(iii) In which year is the increase in expenditure maximum over the expenditure in previous year? What is the maximum increase?
Read the following bar graph and answer the following questions:
(i) What information is given by the bar graph?
(ii) In which year the export is minimum?
(iii)In which year the import is maximum?
(iv)In which year the difference of the values of export and import is maximum?

The income and expenditure for 5 years of a family is given in the following data:
| Years | 1995-96 | 1996-97 | 1997-98 | 1998-99 | 1999-2000 |
| Income (Rs. inthousands) |
100 | 140 | 150 | 170 | 210 |
| Expenditure (Rs. in thousands) |
80 | 130 | 145 | 160 | 190 |
Represent the above data by a gar graph.
The following tables gives the quantity of goods (in crore tonnes)
| Year | 1950-51 | 1960-61 | 1965-66 | 1970-71 | 1980-81 | 1982-83 |
| Quantity of Goods (in crore tonnes) |
9 | 16 | 20 | 20 | 22 | 26 |
Explain through the bar graph if the quantity of goods carried by the Indian Railways in 1965-66 is more than double the quantity of goods carried in the year 1950-51.
The expenditure (in 10 crores of rupees) on health by the Government of India during the various five year plans is shown below:
| Plans: | I | II | III | IV | V | VI |
| Expenditure on health (in 10 crores of rupees) |
7 | 14 | 23 | 34 | 76 | 182 |
Construct a bar graph to represent the above data.
In the 'less than' type of ogive the cumulative frequency is plotted against
For the following table, draw a bar-graph
| A | B | C | D | E | F |
| 230 | 400 | 350 | 200 | 380 | 160 |
Is it correct to say that in a histogram, the area of each rectangle is proportional to the class size of the corresponding class interval? If not, correct the statement.
Following table shows a frequency distribution for the speed of cars passing through at a particular spot on a high way:
| Class interval (km/h) | Frequency |
| 30 – 40 | 3 |
| 40 – 50 | 6 |
| 50 – 60 | 25 |
| 60 – 70 | 65 |
| 70 – 80 | 50 |
| 80 – 90 | 28 |
| 90 – 100 | 14 |
Draw a histogram and frequency polygon representing the data above.
