Advertisements
Advertisements
प्रश्न
The following table gives production yield per hectare of wheat of 100 farms of a village:
| Production yield in kg per hectare: | 50 - 55 | 55 - 60 | 60 - 65 | 65 - 70 | 70 - 75 | 75 - 80 |
| Number of farms: | 2 | 8 | 12 | 24 | 38 | 16 |
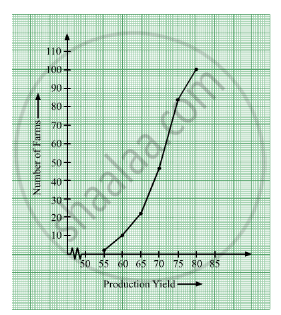
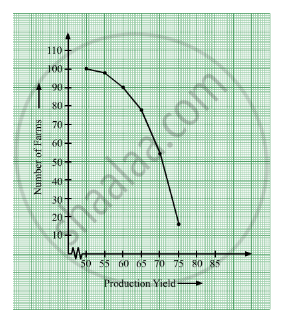
Draw ‘less than’ ogive and ‘more than’ ogive.
उत्तर
Prepare a table for less than type.
Production yield |
No. of farms |
Production yield (less than) |
Cumulative frequency |
Suitable points |
| 50−55 | 2 | 55 | 2 | (55, 2) |
| 55−60 | 8 | 60 | 10 | (60, 10) |
| 60−65 | 12 | 65 | 22 | (65, 22) |
| 65−70 | 24 | 70 | 46 | (70, 46) |
| 70−75 | 38 | 75 | 84 | (75, 84) |
| 75−80 | 16 | 80 | 100 | (80, 100) |
Now, plot the less than ogive using suitable points.
Again, prepare a table for more than type.
| Production yield |
No. of farms |
Production yield (more than) |
Cumulative frequency |
Suitable points |
| 50-55 | 2 | 50 | 100 | (50, 100) |
| 55-60 | 8 | 55 | 98 | (55, 98) |
| 60-65 | 12 | 60 | 90 | (60, 90) |
| 65-70 | 24 | 65 | 78 | (65, 78) |
| 70-75 | 38 | 70 | 54 | (70, 54) |
| 75-80 | 16 | 75 | 16 | (75, 16) |
Now, plot the more than ogive with suitable points.
APPEARS IN
संबंधित प्रश्न
The weight of 50 workers is given below:
| Weight in Kg | 50-60 | 60-70 | 70-80 | 80-90 | 90-100 | 100-110 | 110-120 |
| No. of Workers | 4 | 7 | 11 | 14 | 6 | 5 | 3 |
Draw an ogive of the given distribution using a graph sheet. Take 2 cm = 10 kg on one axis and 2 cm = 5 workers along the other axis. Use a graph to estimate the following:
1) The upper and lower quartiles.
2) If weighing 95 kg and above is considered overweight, find the number of workers who are overweight.
Draw an ogive to represent the following frequency distribution:
| Class-interval: | 0 - 4 | 5 - 9 | 10 - 14 | 15 - 19 | 20 - 24 |
| Frequency: | 2 | 6 | 10 | 5 | 3 |
The annual profits earned by 30 shops of a shopping complex in a locality give rise to the following distribution:
| Profit (in lakhs in Rs) | Number of shops (frequency) |
| More than or equal to 5 More than or equal to 10 More than or equal to 15 More than or equal to 20 More than or equal to 25 More than or equal to 30 More than or equal to 35 |
30 28 16 14 10 7 3 |
Draw both ogives for the above data and hence obtain the median.
Draw an ogive for the following distributions:
| Age in years (less than) | 10 | 20 | 30 | 40 | 50 | 60 | 70 |
| Cumulative frequency | 0 | 17 | 32 | 37 | 53 | 58 | 65 |
Draw an ogive for the following :
| Class Interval | 100-150 | 150-200 | 200-250 | 250-300 | 300-350 | 350-400 |
| Frequency | 10 | 13 | 17 | 12 | 10 | 8 |
Draw an ogive for the following :
| Age in years | Less than 10 | Less than 20 | Less than 30 | Less than 40 | Less than 50 |
| No. of people | 0 | 17 | 42 | 67 | 100 |
Draw an ogive for the following :
| Marks obtained | More than 10 | More than 20 | More than 30 | More than 40 | More than 50 |
| No. of students | 8 | 25 | 38 | 50 | 67 |
Find the width of class 35 - 45.
The following is the frequency distribution with unknown frequencies :
| Class | 60-70 | 70-80 | 80-90 | 90-100 | Total |
| frequency | `"a"/2` | `(3"a")/2` | 2a | a | 50 |
Find the value of a, hence find the frequencies. Draw a histogram and frequency polygon on the same coordinate system.
Cumulative frequency curve is also called ______.
