Advertisements
Advertisements
प्रश्न
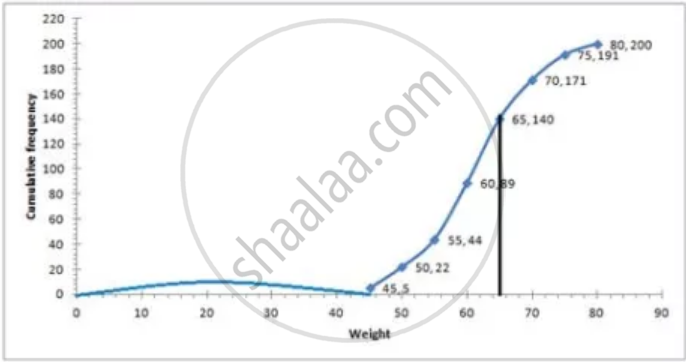
Using a graph paper, draw an ogive for the following distribution which shows a record of the width in kilograms of 200 students.
| Weight | Frequency |
| 40 – 45 | 5 |
| 45 – 50 | 17 |
| 50 – 55 | 22 |
| 55 – 60 | 45 |
| 60 – 65 | 51 |
| 65 – 70 | 31 |
| 70 – 75 | 20 |
| 75 – 80 | 9 |
Use your ogive to estimate the following:
- The percentage of student weighting 55 kg or more
- The weight above which the heaviest 30% of the student fall
- The number of students who are
- underweight
- overweight, If 55.70 kg is considered as standard weight.
उत्तर
| Weight | Frequency | C.f |
| 40 – 45 | 5 | 5 |
| 45 – 50 | 17 | 22 |
| 50 – 55 | 22 | 44 |
| 55 – 60 | 45 | 89 |
| 60 – 65 | 51 | 140 |
| 65 – 70 | 31 | 171 |
| 70 – 75 | 20 | 191 |
| 75 – 80 | 9 | 200 |

i. Number of students weighing more than 55 kg = 200 – 44 = 156
Therefore, percentage of students weighing 55 kg or more
= `156/200 xx 100`
= 78%
ii. 30% of students = `(30 xx 200)/100 = 60`
Heaviest 60 students in weight = 9 + 21 + 30 = 60
Weight = 65 kg ...(From table)
iii. a. underweight students when 55.70 kg is standard = 46 (approx) from graph
b. overweight student when 55.70 kg is standard = 200 – 46 = 154 (approx) from graph
APPEARS IN
संबंधित प्रश्न
Find the mean of the following set of numbers:
6, 9, 11, 12 and 7
The mean of the number 6, ‘y’, 7, ‘x’ and 14 is 8. Express ‘y’ in terms of ‘x’.
The following are the marks obtained by 70 boys in a class test:
| Marks | No. of boys |
| 30 – 40 | 10 |
| 40 – 50 | 12 |
| 50 – 60 | 14 |
| 60 – 70 | 12 |
| 70 – 80 | 9 |
| 80 – 90 | 7 |
| 90 – 100 | 6 |
Calculate the mean by:
Short-cut method
The monthly income of a group of 320 employees in a company is given below:
| Monthly income (thousands) | No. of employees |
| 6-7 | 20 |
| 7-8 | 45 |
| 8-9 | 65 |
| 9-10 | 95 |
| 10-11 | 60 |
| 11-12 | 30 |
| 12-13 | 5 |
Draw an ogive of the distribution on a graph paper taking 2 cm = Rs. 1000 on one axis and 2 cm = 50 employees on the other axis. From the graph detemine:
- the median wage.
- number of employee whose income is below Rs. 8,500.
- If salary of a senior employee is above Rs. 11,500, find the number of senior employee in the company.
- the upper quartile.
Find the mean of the following frequency distribution by the short cut method :
| Class | 1-10 | 11-20 | 21-30 | 31-40 | 41-50 | 51-60 | 61-70 |
| Frequency | 7 | 10 | 14 | 17 | 15 | 11 | 6 |
If different values of variable x are 19.8, 15.4, 13.7, 11.71, 11.8, 12.6, 12.8, 18.6, 20.5 and 2.1, find the mean.
Find the mean of: first five odd natural numbers
Find the median of 1,3,4, 5, 9, 9 and 11
A boy scored the following marks in various class tests during a term, each test being marked out of 20.
15, 17, 16, 7, 10, 12, 14, 16, 19, 12, 16
What is his median marks?
Find the median of the given data: 36, 44, 86, 31, 37, 44, 86, 35, 60, 51
