Advertisements
Advertisements
प्रश्न
Using a graph paper, draw an ogive for the following distribution which shows a record of the width in kilograms of 200 students.
| Weight | Frequency |
| 40 – 45 | 5 |
| 45 – 50 | 17 |
| 50 – 55 | 22 |
| 55 – 60 | 45 |
| 60 – 65 | 51 |
| 65 – 70 | 31 |
| 70 – 75 | 20 |
| 75 – 80 | 9 |
Use your ogive to estimate the following:
- The percentage of student weighting 55 kg or more
- The weight above which the heaviest 30% of the student fall
- The number of students who are
- underweight
- overweight, If 55.70 kg is considered as standard weight.
उत्तर
| Weight | Frequency | C.f |
| 40 – 45 | 5 | 5 |
| 45 – 50 | 17 | 22 |
| 50 – 55 | 22 | 44 |
| 55 – 60 | 45 | 89 |
| 60 – 65 | 51 | 140 |
| 65 – 70 | 31 | 171 |
| 70 – 75 | 20 | 191 |
| 75 – 80 | 9 | 200 |
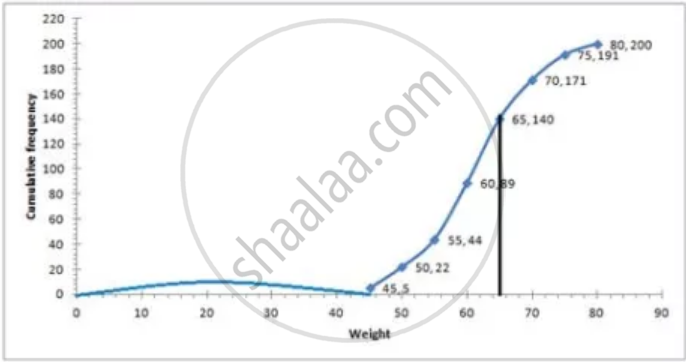
i. Number of students weighing more than 55 kg = 200 – 44 = 156
Therefore, percentage of students weighing 55 kg or more
= `156/200 xx 100`
= 78%
ii. 30% of students = `(30 xx 200)/100 = 60`
Heaviest 60 students in weight = 9 + 21 + 30 = 60
Weight = 65 kg ...(From table)
iii. a. underweight students when 55.70 kg is standard = 46 (approx) from graph
b. overweight student when 55.70 kg is standard = 200 – 46 = 154 (approx) from graph
APPEARS IN
संबंधित प्रश्न
Calculate the mean of the distribution given below using the shortcut method.
| Marks | 11-20 | 21-30 | 31-40 | 41-50 | 51-60 | 61-70 | 71-80 |
| No. of students | 2 | 6 | 10 | 12 | 9 | 7 | 4 |
Attempt this question on a graph paper. The table shows the distribution of marks gained by a group of 400 students in an examination.
|
Marks (Less than ) |
10 | 20 | 30 | 40 | 50 | 60 | 70 | 80 | 90 | 100 |
| No.of student | 5 | 10 | 30 | 60 | 105 | 180 | 270 | 355 | 390 | 400 |
Using scaie of 2cm to represent 10 marks and 2 cm to represent 50 student, plot these point and draw a smooth curve though the point
Estimate from the graph :
(1)the median marks
(2)the quartile marks.
The frequency distribution table below shows the height of 50 students of grade 10.
| Heights (in cm) | 138 | 139 | 140 | 141 | 142 |
| Frequency | 6 | 11 | 16 | 10 | 7 |
Find the median, the upper quartile and the lower quartile of the heights.
The mean of a certain number of observations is 32. Find the resulting mean, if the observation is, decreased by 7
The mean of five numbers is 27. If one number is excluded, the mean of the remaining numbers is 25. Find the excluded number.
Find the median of 17, 23, 36, 12, 18, 23, 40 and 20
Find the mean and the median of: 1.2, 1.9, 2.2, 2.6 and 2.9
The median of the data 12, 14, 23, 25, 34, 11, 42, 45, 32, 22, 44 is ___________
Find the median of the given data: 35, 25, 34, 36, 45, 18, 28
The median class for the given distribution is:
| Class Interval | 1 - 5 | 6 - 10 | 11 - 15 | 16 - 20 |
| Cumulative Frequency | 2 | 6 | 11 | 18 |
