Topics
Roman Numerals
Number Work
Addition and Subtraction
Multiplication and Division
Fractions
Angles
Circles
Multiples and Factors
Decimal Fractions
- Decimal Fractions
- The Decimal Number System
- Concept of Tenths, Hundredths and Thousandths in Decimal
- Concept of Place Value
- Use of Decimal Fraction
- Writing Half, Quarter, Three-quarters and One and a Quarter in Decimal Form
- Addition of Decimal Fraction
- Subtraction of Decimal Fraction
- Decimals Used for Measurement
Measuring Time
Problems on Measurement
Perimeter and Area
Three Dimensional Objects and Nets
Pictographs
Patterns
Preparation for Algebra
Pictorial Representation of Numerical Data
The expression or illustration regarding the different information about any object or objects or activities through pictures or picture symbols is called pictorial representation or pictograph.
To create a pictograph, the following steps must be followed:
- Analyse the given numerical data.
- Determine the factors of all the numbers to be represented.
- Select an appropriate scale.
- Choose a suitable symbol.
- Organise the pictograph into appropriate columns.
- Clearly mention the scale used below the pictograph.
Example:
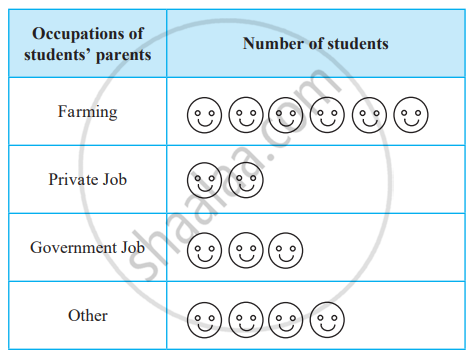
Information collected from 150 students about their parents’ occupations is given below. Make a pictograph based on it.
| Occupations of students’ parents | Number of students |
| Farming | 60 |
| Private Job | 20 |
| Government Job | 30 |
| Other | 40 |
All the given numbers can be divided by 2, 5, and 10. ‘ 1 picture for 10 students’ will be a convenient scale. So, we will draw 6 pictures for 60 students, 2 for 20, 3 for 30, and 4 for 40 students.
Our pictograph will look like the one given below.

Scale: 1 picture = 10 students
Related QuestionsVIEW ALL [3]
Stocks of various types of grains stored in a warehouse are as given below. Make a pictograph based on the information given.
| Grain | Sacks |
| Rice | 40 |
| Wheat | 56 |
| Bajra | 8 |
| Jowar | 32 |
Information about the various types of vehicles in Wadgaon is given below. Make a pictograph for this data.
| Types of vehicles | Number |
| Bicycles | 84 |
| Automatic two-wheelers | 60 |
| Four-wheelers (cars/jeeps) | 24 |
| Heavy vehicles (truck, bus, etc.) | 12 |
| Tractors | 24 |
The numbers of the various books kept in a cupboard in the school library are given below. Make a pictograph showing the information given.
| Type of book | Number |
| Science | 28 |
| Sports | 14 |
| Poetry | 21 |
| Literature | 35 |
| History | 7 |
