Advertisements
Advertisements
प्रश्न
Draw the graph for the equation, given below :
x - 5y + 4 = 0
उत्तर
x - 5y + 4 = 0
⇒ 5y = 4 + x
∴ y = `(x + 4)/(5)`
When x = 1;
y = `(1 + 4)/(5)`
= `(5)/(5)`
= 1
When x = 6;
y = `(6 + 4)/(5)`
= `(10)/(5)`
= 2
When x = - 4;
y = `(-4 + 4)/(5)`
= `(0)/(5)`
= 0
| X | 1 | 6 | - 4 |
| Y | 1 | 2 | 0 |
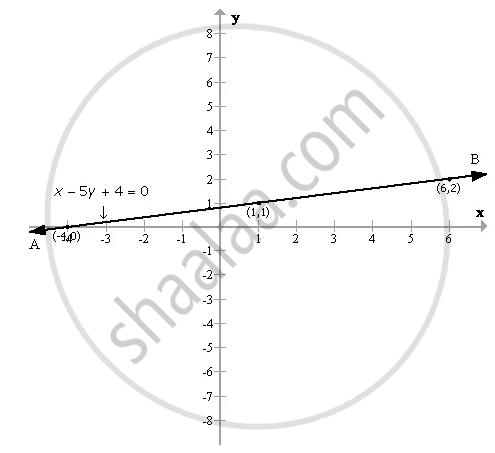
Plotting these points we get the required graph as shown below :

APPEARS IN
संबंधित प्रश्न
Draw the graph of the following linear equation in two variables:
x + y = 4
Draw the graph of the following linear equations in two variables:
x – y = 2
Draw the graph of the following linear equations in two variables:- 3 = 2x + y
Draw the graph of the following linear equations in two variable : 2𝑦 = −𝑥 + 1
Draw the graph of the equation 2x - 3y - 5 = 0
From the graph, find:
(i) x1, the value of x, when y = 7
(ii) x2, the value of x, when y = - 5.
Draw the graph for each of the following equation: Also, find the coordinates of the points where the graph of the equation meets the coordinate axes:
`(3x + 14)/(2) = (y - 10)/(5)`
Draw the graph for the following
3x + 2y = 14
Every point on the graph of a linear equation in two variables does not represent a solution of the linear equation.
The following observed values of x and y are thought to satisfy a linear equation. Write the linear equation:
| x | 6 | – 6 |
| y | –2 | 6 |
Draw the graph using the values of x, y as given in the above table. At what points the graph of the linear equation
- cuts the x-axis
- cuts the y-axis
The following observed values of x and y are thought to satisfy a linear equation. Write the linear equation:
| x | 6 | – 6 |
| y | –2 | 6 |
Draw the graph using the values of x, y as given in the above table. At what points the graph of the linear equation cuts the y-axis
