Advertisements
Advertisements
प्रश्न
Draw the graphs of the following linear equations:
5x - 5y = 8
उत्तर
5x - 5y = 8
⇒ 5x = 8 - 5y
⇒x = `(8 - 5y)/(5)`
Corresponding values of x and can be tabulated as follows :
| X | 1.6 | 0.6 | 2.6 |
| Y | 0 | 1 | 1 |
Plotting the points (1.6, 0), (0.6, 1) and (2.6, -1),
we get the following graph :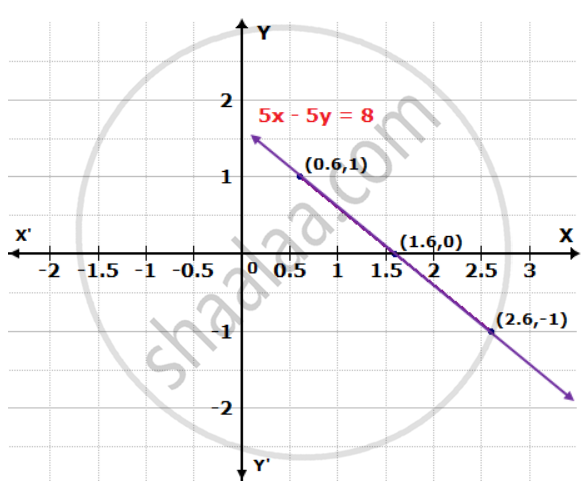
APPEARS IN
संबंधित प्रश्न
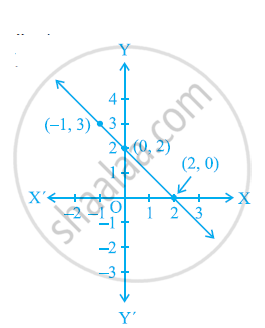
From the choices given below, choose the equation whose graphs are given in the given figures.
For the first figure
(i) y = x
(ii) x + y = 0
(iii) y = 2x
(iv) 2 + 3y = 7x

For the second figure
(i) y = x +2
(ii) y = x − 2
(iii) y = − x + 2
(iv) x + 2y = 6
Draw the graph of the following linear equation in two variable : `(x-2)/3 = y - 3`
Draw the graph of the equatio ` x / y + y /4 = 1` Also, find the area of the triangle formed by the
line and the co-ordinates axes.
Draw the graph for the equation, given below :
5x + y + 5 = 0
Draw the graph of the following equation:
x = – 7
Draw the graph of y = 2x + 5
The graph of the linear equation 2x + 3y = 6 cuts the y-axis at the point ______.
The point (0, 3) lies on the graph of the linear equation 3x + 4y = 12.
The following observed values of x and y are thought to satisfy a linear equation. Write the linear equation:
| x | 6 | – 6 |
| y | –2 | 6 |
Draw the graph using the values of x, y as given in the above table. At what points the graph of the linear equation
- cuts the x-axis
- cuts the y-axis
Draw the graph of the linear equation 3x + 4y = 6. At what points, the graph cuts the x-axis and the y-axis.
