Advertisements
Advertisements
प्रश्न
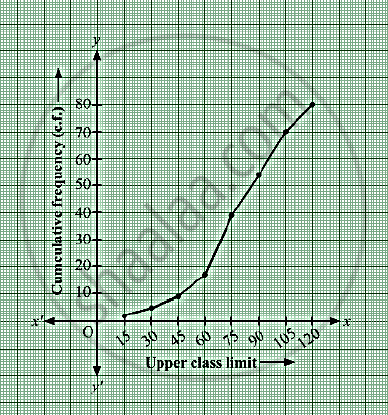
The given distribution shows the number of wickets taken by the bowlers in one-day international cricket matches:
| Number of Wickets | Less than 15 | Less than 30 | Less than 45 | Less than 60 | Less than 75 | Less than 90 | Less than 105 | Less than 120 |
| Number of bowlers | 2 | 5 | 9 | 17 | 39 | 54 | 70 | 80 |
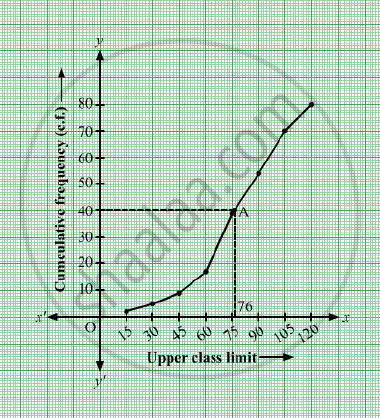
Draw a ‘less than type’ ogive from the above data. Find the median.
उत्तर
Taking upper class limits of class intervals on x-axis and their respective frequencies on y-axis, its ogive can be drawn as follows:

Here, N = 80 ⇒` N/2` = 40.
Mark the point A whose ordinate is 40 and
its x-coordinate is 76.

Thus, median of the data is 76.
APPEARS IN
संबंधित प्रश्न
The following table gives production yield per hectare of wheat of 100 farms of a village.
| Production yield (in kg/ha) | 50 − 55 | 55 − 60 | 60 − 65 | 65 − 70 | 70 − 75 | 75 − 80 |
| Number of farms | 2 | 8 | 12 | 24 | 38 | 16 |
Change the distribution to a more than type distribution and draw ogive.
From the following data, draw the two types of cumulative frequency curves and determine the median:
| Marks | Frequency |
| 140 – 144 | 3 |
| 144 – 148 | 9 |
| 148 – 152 | 24 |
| 152 – 156 | 31 |
| 156 – 160 | 42 |
| 160 – 164 | 64 |
| 164 – 168 | 75 |
| 168 – 172 | 82 |
| 172 – 176 | 86 |
| 176 – 180 | 34 |
What is the lower limit of the modal class of the following frequency distribution?
| Age (in years) | 0 - 10 | 10- 20 | 20 -30 | 30 – 40 | 40 –50 | 50 – 60 |
| Number of patients | 16 | 13 | 6 | 11 | 27 | 18 |
The following frequency distribution gives the monthly consumption of electricity of 64 consumers of locality.
| Monthly consumption (in units) | 65 – 85 | 85 – 105 | 105 – 125 | 125 – 145 | 145 – 165 | 165 – 185 |
| Number of consumers | 4 | 5 | 13 | 20 | 14 | 8 |
Form a ‘ more than type’ cumulative frequency distribution.
If the median of the following frequency distribution is 32.5. Find the values of f1 and f2.
| Class | 0-10 | 10-20 | 20-30 | 30-40 | 40-50 | 50-60 | 60-70 | Total |
| Frequency | f1 | 5 | 9 | 12 | f2 | 3 | 2 | 40 |
The marks obtained by 100 students of a class in an examination are given below.
| Mark | No. of Student |
| 0 - 5 | 2 |
| 5 - 10 | 5 |
| 10 - 15 | 6 |
| 15 - 20 | 8 |
| 20 - 25 | 10 |
| 25 - 30 | 25 |
| 30 - 35 | 20 |
| 35 - 40 | 18 |
| 40 - 45 | 4 |
| 45 - 50 | 2 |
Draw 'a less than' type cumulative frequency curves (ogive). Hence find the median.
Change the following distribution to a 'more than type' distribution. Hence draw the 'more than type' ogive for this distribution.
| Class interval: | 20−30 | 30−40 | 40−50 | 50−60 | 60−70 | 70−80 | 80−90 |
| Frequency: | 10 | 8 | 12 | 24 | 6 | 25 | 15 |
Find the unknown entries a, b, c, d, e, f in the following distribution of heights of students in a class:
| Height (in cm) |
Frequency | Cumulative frequency |
| 150 – 155 | 12 | a |
| 155 – 160 | b | 25 |
| 160 – 165 | 10 | c |
| 165 – 170 | d | 43 |
| 170 – 175 | e | 48 |
| 175 – 180 | 2 | f |
| Total | 50 |
The following are the ages of 300 patients getting medical treatment in a hospital on a particular day:
| Age (in years) | 10 – 20 | 20 – 30 | 30 – 40 | 40 – 50 | 50 – 60 | 60 – 70 |
| Number of patients | 60 | 42 | 55 | 70 | 53 | 20 |
Form: Less than type cumulative frequency distribution.
The following are the ages of 300 patients getting medical treatment in a hospital on a particular day:
| Age (in years) | 10 – 20 | 20 – 30 | 30 – 40 | 40 – 50 | 50 – 60 | 60 – 70 |
| Number of patients | 60 | 42 | 55 | 70 | 53 | 20 |
Form: More than type cumulative frequency distribution.
