Advertisements
Advertisements
Question
The given distribution shows the number of wickets taken by the bowlers in one-day international cricket matches:
| Number of Wickets | Less than 15 | Less than 30 | Less than 45 | Less than 60 | Less than 75 | Less than 90 | Less than 105 | Less than 120 |
| Number of bowlers | 2 | 5 | 9 | 17 | 39 | 54 | 70 | 80 |
Draw a ‘less than type’ ogive from the above data. Find the median.
Solution
Taking upper class limits of class intervals on x-axis and their respective frequencies on y-axis, its ogive can be drawn as follows:
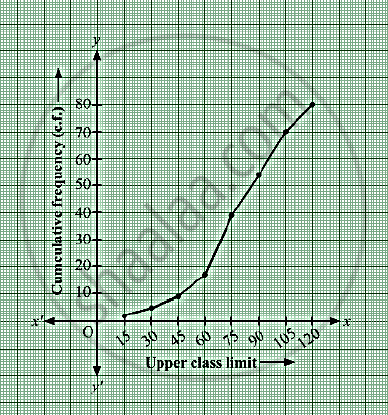
Here, N = 80 ⇒` N/2` = 40.
Mark the point A whose ordinate is 40 and
its x-coordinate is 76.
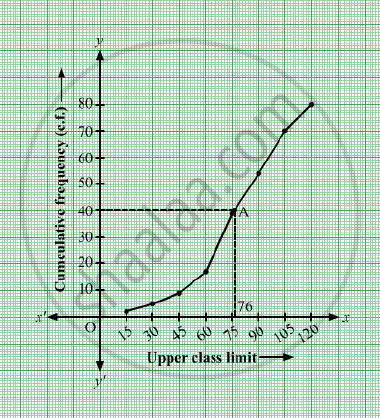
Thus, median of the data is 76.
APPEARS IN
RELATED QUESTIONS
The monthly profits (in Rs.) of 100 shops are distributed as follows:
| Profits per shop: | 0 - 50 | 50 - 100 | 100 - 150 | 150 - 200 | 200 - 250 | 250 - 300 |
| No. of shops: | 12 | 18 | 27 | 20 | 17 | 6 |
Draw the frequency polygon for it.
The heights of 50 girls of Class X of a school are recorded as follows:
| Height (in cm) | 135 - 140 | 140 – 145 | 145 – 150 | 150 – 155 | 155 – 160 | 160 – 165 |
| No of Students | 5 | 8 | 9 | 12 | 14 | 2 |
Draw a ‘more than type’ ogive for the above data.
From the following data, draw the two types of cumulative frequency curves and determine the median:
| Marks | Frequency |
| 140 – 144 | 3 |
| 144 – 148 | 9 |
| 148 – 152 | 24 |
| 152 – 156 | 31 |
| 156 – 160 | 42 |
| 160 – 164 | 64 |
| 164 – 168 | 75 |
| 168 – 172 | 82 |
| 172 – 176 | 86 |
| 176 – 180 | 34 |
The following are the ages of 300 patients getting medical treatment in a hospital on a particular day:
| Age (in years) | 10 – 20 | 20 – 30 | 30 – 40 | 40 – 50 | 50 – 60 | 60 -70 |
| Number of patients | 6 | 42 | 55 | 70 | 53 | 20 |
Form a ‘less than type’ cumulative frequency distribution.
The following table, construct the frequency distribution of the percentage of marks obtained by 2300 students in a competitive examination.
| Marks obtained (in percent) | 11 – 20 | 21 – 30 | 31 – 40 | 41 – 50 | 51 – 60 | 61 – 70 | 71 – 80 |
| Number of Students | 141 | 221 | 439 | 529 | 495 | 322 | 153 |
(a) Convert the given frequency distribution into the continuous form.
(b) Find the median class and write its class mark.
(c) Find the modal class and write its cumulative frequency.
The median of the distribution given below is 14.4 . Find the values of x and y , if the total frequency is 20.
| Class interval : | 0-6 | 6-12 | 12-18 | 18-24 | 24-30 |
| Frequency : | 4 | x | 5 | y | 1 |
Write the median class for the following frequency distribution:
| Class-interval: | 0−10 | 10−20 | 20−30 | 30−40 | 40−50 | 50−60 | 60−70 | 70−80 |
| Frequency: | 5 | 8 | 7 | 12 | 28 | 20 | 10 | 10 |
If the median of the following frequency distribution is 32.5. Find the values of f1 and f2.
| Class | 0-10 | 10-20 | 20-30 | 30-40 | 40-50 | 50-60 | 60-70 | Total |
| Frequency | f1 | 5 | 9 | 12 | f2 | 3 | 2 | 40 |
Calculate the mean of the following frequency distribution :
| Class: | 10-30 | 30-50 | 50-70 | 70-90 | 90-110 | 110-130 |
| Frequency: | 5 | 8 | 12 | 20 | 3 | 2 |
The following is the distribution of weights (in kg) of 40 persons:
| Weight (in kg) | 40 – 45 | 45 – 50 | 50 – 55 | 55 – 60 | 60 – 65 | 65 – 70 | 70 – 75 | 75 – 80 |
| Number of persons | 4 | 4 | 13 | 5 | 6 | 5 | 2 | 1 |
Construct a cumulative frequency distribution (of the less than type) table for the data above.
