Advertisements
Advertisements
Question
Draw a histogram from the following frequency distribution and find the mode from the graph:
| Class | 0-5 | 5-10 | 10-15 | 15-20 | 20-25 | 25-30 |
| Frequency | 2 | 5 | 18 | 14 | 8 | 5 |
Solution 1
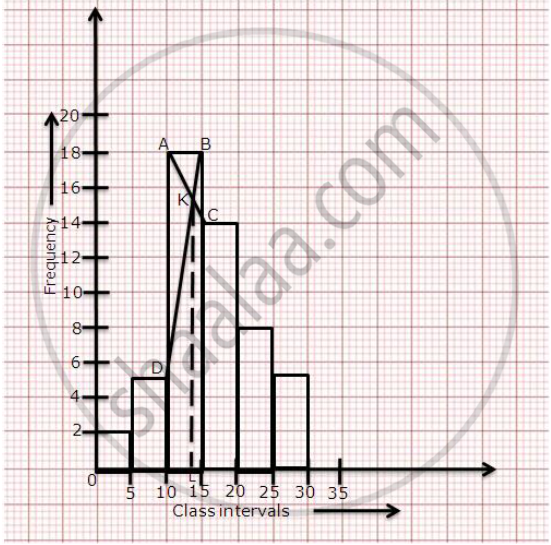
Steps for calculation of mode.
(1) Mark the endpoints of the upper corner of the rectangle with maximum frequency
as A and B.
(2) Mark the inner corner of adjacent rectangles as C and D.
(3) Join AC and BD to intersect at K. From K, draw KL perpendicular to the x-axis.
(4) The value of L on the x-axis represents the mode. Thus, Mode = 13
Solution 2
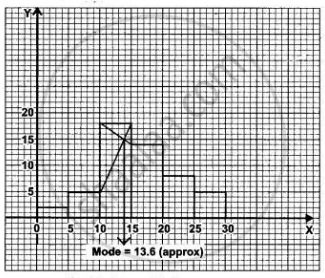
Mode = 13·6
APPEARS IN
RELATED QUESTIONS
By drawing an ogive, estimate the median for the following frequency distribution:
| Weight (kg) | 10 – 15 | 15 – 20 | 20 – 25 | 25 – 30 | 30 – 35 |
| No. of boys | 11 | 25 | 12 | 5 | 2 |
Find the mean, median and mode of the following marks obtained by 16 students in a class test marked out of 10 marks:
0, 0, 2, 2, 3, 3, 3, 4, 5, 5, 5, 5, 6, 6, 7 and 8.
If the mean of 11 , 14 , p , 26 , 10 , 12 , 18 , 6 is 15, find p.
Find the mode of the following frequency distribution:
| Variate | 20 | 21 | 22 | 23 | 24 | 25 | 26 |
| Frequency | 21 | 20 | 26 | 35 | 22 | 13 | 10 |
Find the rnedian of the first 15 whole numbers .
Find the mean of first six natural numbers.
Calculate the median of the following sets of number:
1, 9, 10, 8, 2, 4, 4, 3, 9, 1, 5, 6, 2 and 4.
Find the median of the 10 observations 36, 33, 45, 28, 39, 45, 54, 23, 56, 25. If another observation 35 is added to the above data, what would be the new median?
The marks scored by the students in social test out of 20 marks are as follows: 12, 10, 8, 18, 14, 16. Find the mean and median?
The median class for the given distribution is:
| Class Interval | 1 - 5 | 6 - 10 | 11 - 15 | 16 - 20 |
| Cumulative Frequency | 2 | 6 | 11 | 18 |
