Advertisements
Advertisements
Question
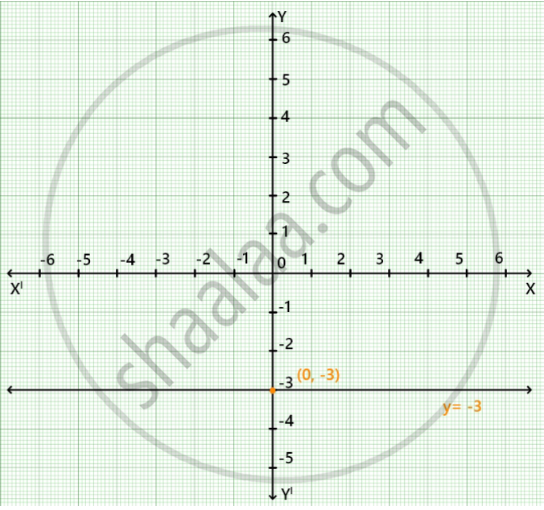
Draw the graph of the equation represented by a straight line which is parallel to the x-axis and at a distance 3 units below it.
Solution
The graph of the equation y = – 3 is parallel to the x-axis and at a distance 3 units and passing through the point (0, – 3) as show in the figure given below.
APPEARS IN
RELATED QUESTIONS
Give the equations of two lines passing through (2, 14). How many more such lines are there, and why?
In countries like USA and Canada, temperature is measured in Fahrenheit, whereas in countries like India, it is measured in Celsius. Here is a linear equation that converts Fahrenheit to Celsius:-
`F=(9/5)C+32`
(i) Draw the graph of the linear equation above using Celsius for x-axis and Fahrenheit for y-axis.
(ii) If the temperature is 30°C, what is the temperature in Fahrenheit?
(iii) If the temperature is 95°F, what is the temperature in Celsius?
(iv) If the temperature is 0°C, what is the temperature in Fahrenheit and if the temperature is 0°F, what is the temperature in Celsius?
(v) Is there a temperature which is numerically the same in both Fahrenheit and Celsius? If yes, find it.
Draw the graph of y = | x |.
Draw the graph for the equation, given below :
3x + 2y = 6
Draw the graph for the equation given below; hence find the co-ordinates of the points where the graph is drawn meets the co-ordinates axes:
`(2x + 15)/(3) = y - 1`
Draw the graph of the equation 2x - 3y - 5 = 0
From the graph, find:
(i) x1, the value of x, when y = 7
(ii) x2, the value of x, when y = - 5.
Draw the graph for each of the following equation: Also, find the coordinates of the points where the graph of the equation meets the coordinate axes:
`(1)/(2) x + (1)/(3) y` = 1
Draw the graph of the equation
y = 5x - 4 Find graphically
a. the value of x, when y = 1
b. the value of y, when x = -2
Draw the graph for the following
y = 2x
The graph of the linear equation y = x passes through the point ______.
