Advertisements
Advertisements
Question
Estimate the median, the lower quartile and the upper quartile of the following frequency distribution by drawing an ogive:
| Age( in yrs) | Under 10 | Under 20 | Under 30 | Under 40 | Under 50 | Under 60 |
| No. of males | 6 | 10 | 25 | 32 | 43 | 50 |
Solution
Given data is cumulative data , so draw the ogive as it is .
| Age (in yrs) Under | No. of males (f) |
| 10 | 6 |
| 20 | 10 |
| 30 | 25 |
| 40 | 32 |
| 50 | 43 |
| 60 | 50 |
Take a graph paper and draw both the axes.
On the x-axis , take a scale of 1cm = 10 to represent the Age (in yrs) under.
On the y-axis , take a scale of 1cm = 10 to represent the no. of males.
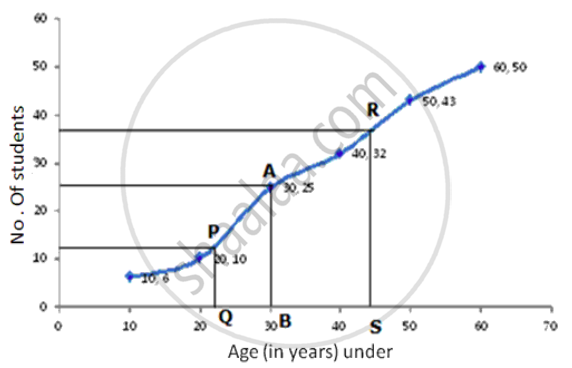
Now , plot the points (10,6) , (20,10) , (30,25) ,(40,32) , (50,43) ,(60,5).
Join them by a smooth curve to get the ogive.
No. of terms = 50
∴ Median = `(25+26)/2` = 25.5th term
Through mark of 25.5 on y-axis draw a line parallel to x-axis which meets the curve at A. From A, draw a perpendicular to x-axis which meets it at B.
The value of B is the median which is 30.
Lower Quartile (Q1) = `n/4 = 50/4` = 12.5th term
Through mark of 12.5 on y-axis draw a line parallel to x-axis which meets the curve at P. From a perpendicular to x-axis which meets it at Q.
The value of Q is the lower quartile which is 22.
Upper Quartile (Q3) = `(n xx 3)/4 = (50 xx 3)/4` = 37.5th term
Through mark of 37.5 on y-axis draw a line parallel to x-axis which meets the curve at R. From R, draw a perpendicular to x-axis which meets it at S.
The value of S is the upper quartile which is 44.
APPEARS IN
RELATED QUESTIONS
Draw a histogram from the following frequency distribution and find the mode from the graph:
| Class | 0-5 | 5-10 | 10-15 | 15-20 | 20-25 | 25-30 |
| Frequency | 2 | 5 | 18 | 14 | 8 | 5 |
The following are the marks obtained by 70 boys in a class test:
| Marks | No. of boys |
| 30 – 40 | 10 |
| 40 – 50 | 12 |
| 50 – 60 | 14 |
| 60 – 70 | 12 |
| 70 – 80 | 9 |
| 80 – 90 | 7 |
| 90 – 100 | 6 |
Calculate the mean by:
Short-cut method
From the following cumulative frequency table, draw ogive and then use it to find:
- Median
- Lower quartile
- Upper quartile
| Marks (less than) | 10 | 20 | 30 | 40 | 50 | 60 | 70 | 80 | 90 | 100 |
| Cumulative frequency | 5 | 24 | 37 | 40 | 42 | 48 | 70 | 77 | 79 | 80 |
For the following set of data, find the median:
10, 75, 3, 81, 17, 27, 4, 48, 12, 47, 9 and 15.
In a case of 40 students, marks obtained by the students in a class test (out of 10) are given below:
| Marks | 1 | 2 | 3 | 4 | 5 | 6 | 7 | 8 | 9 | 10 |
| Number of students | 1 | 2 | 3 | 3 | 6 | 10 | 5 | 4 | 3 | 3 |
Calculate the following for the given distribution:
(i) Median
(ii) Mode
Find the mode of the following frequency distribution:
| Variate | 20 | 21 | 22 | 23 | 24 | 25 | 26 |
| Frequency | 21 | 20 | 26 | 35 | 22 | 13 | 10 |
The mean of a certain number of observations is 32. Find the resulting mean, if the observation is, increased by 3
Find the mean of: 7, 10, 4 and 17
Find the median of 1,3,4, 5, 9, 9 and 11
The median of the data: 3, 4, 5, 6, 7, 3, 4 is ______.
