Advertisements
Advertisements
Question
Find the lower quartile, the upper quartile, the interquartile range and the semi-interquartile range for the following frequency distributions:
| Variate | 10 | 11 | 12 | 13 | 14 | 15 | 16 | 17 | 18 | 19 | 20 |
| Frequency | 1 | 2 | 3 | 1 | 2 | 4 | 2 | 1 | 1 | 2 | 1 |
Solution
| Variate | Frequency (f) | Cumulative frequency |
| 10 | 1 | 1 |
| 11 | 2 | 3 |
| 12 | 3 | 6 |
| 13 | 1 | 7 |
| 14 | 2 | 9 |
| 15 | 4 | 13 |
| 16 | 2 | 15 |
| 17 | 1 | 16 |
| 18 | 1 | 17 |
| 19 | 2 | 19 |
| 20 | 1 | 20 |
No. of terms = 20
Lower Quartile (Q1) = `"n"/4 = 20/4` = 5th term = 12
Upper Quartile (Q3) = `("n" xx 3)/4 = (20 xx 3)/4` = 15th term = 16
Interquartile range = Q3 - Q1 = 16- 12 = 4
Semi-Interquartile range = `(Q_3 - Q_1)/2 = (16-12)/2 = 2`
Hence, Lower quartile = 12, upper quartile = 16, interquartile range = 4, semi-interquartile range = 2
APPEARS IN
RELATED QUESTIONS
Draw histogram for the following frequency distributions:
| Class Interval | 30 – 39 | 40 – 49 | 50 – 59 | 60 – 69 | 70 – 79 |
| Frequency | 24 | 16 | 09 | 15 | 20 |
The table below shows the yield of jowar per acre. Show the data by histogram.
| Yield per acre (quintal) | 2 - 3 | 4 - 5 | 6 - 7 | 8 - 9 | 10 - 11 |
| No. of farmers | 30 | 50 | 55 | 40 | 20 |
In the following table, the investment made by 210 families is shown. Present it in the form of a histogram.
|
Investment
(Thousand Rupees) |
10 - 15 | 15 - 20 | 20 - 25 | 25 - 30 | 30 - 35 |
| No. of families | 30 | 50 | 60 | 55 | 15 |
The following histogram shows the frequency distribution f the ages of 22 teachers in a school:
(i) What is the number of eldest and youngest teachers in the school?
(ii) Which age group teachers are more in the school and which least?
(iii) What is the size of the classes?
(iv) What are the class marks of the classes?
The weekly wages (in Rs.) of 30 workers in a factory are given:
830, 835, 890, 810, 835, 836, 869, 845, 898, 890, 820, 860, 832, 833, 855, 845, 804, 808, 812, 840, 885, 835, 835, 836, 878, 840, 868, 890, 806, 840
Mark a frequency table with intervals as 800-810, 810-820 and so on, using tally marks. Also, draw a histogram and answer the following questions:
(i) Which group has the maximum number of workers?
(ii) How many workers earn Rs 850 and more?
(iii) How many workers earn less than Rs 850?
Construct histograms for following frequency distribution:
| Class Mark | 15 | 25 | 35 | 45 | 50 | 55 | 60 |
| Frenuencv | 6 | 12 | 15 | 18 | 25 | 14 | 10 |
Construct a frequency polygon without using a histogram for the following frequency distribution :
| Class Interval | 10-20 | 20-40 | 40-60 | 60-80 | 80-100 |
| Frequency | 9 | 17 | 15 | 20 | 14 |
The time taken, in seconds, to solve a problem for each of 25 persons is as follows:
| 16 | 20 | 26 | 27 | 28 |
| 30 | 33 | 37 | 38 | 40 |
| 42 | 43 | 46 | 46 | 47 |
| 48 | 49 | 50 | 53 | 58 |
| 59 | 60 | 64 | 52 | 20 |
(i) Construct a frequency distribution for these data using a class interval of 10 seconds.
(ii) In a school the weekly pocket money of 50 students is as follow's:
| Weekly pocket money (₹) | No. of student |
| 40 - 50 | 2 |
| 59 - 60 | 8 |
| 60 - 70 | 12 |
| 70 - 80 | 14 |
| 80 - 90 | 8 |
| 90 - 100 | 6 |
Draw a histogram and a frequency polygon on the same graph. Find mode from the graph.
Identify the following data can be represented in a histogram?
The number of students in each class of a school
Identify the following data can be represented in a histogram?
The wickets fallen from 1 over to 50th over in a one day cricket match
The total area of the histogram is _________ to the total frequency of the given data
Construct a histogram from the following distribution of total marks of 40 students in a class.
| Marks | 90 − 110 | 110 − 130 | 130 − 150 | 150 − 170 | 170 − 190 | 190 − 210 |
| No. of Students | 9 | 5 | 10 | 7 | 4 | 6 |
The graphical representation of ungrouped data is ________
Draw a histogram and the frequency polygon in the same diagram to represent the following data
| Weight (in kg) | 50 − 55 | 56 − 61 | 62 − 67 | 68 − 73 | 74 − 79 | 80 − 85 | 86 − 91 |
| No. of persons | 15 | 8 | 12 | 17 | 9 | 10 | 6 |
In a histogram ______ are drawn with width equal to a class interval without leaving any gap in between.
The following pictorial representation of data is a histogram.
Prepare a histogram from the frequency distribution table obtained in question 93.
The below histogram shows the number of literate females in the age group of 10 to 40 years in a town.
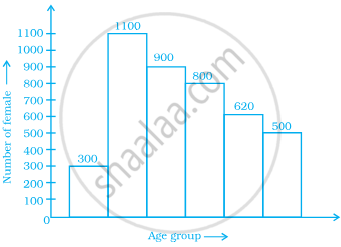
- Write the classes assuming all the classes are of equal width.
- What is the classes width?
- In which age group are literate females the least?
- In which age group is the number of literate females the highest?
