Advertisements
Advertisements
Question
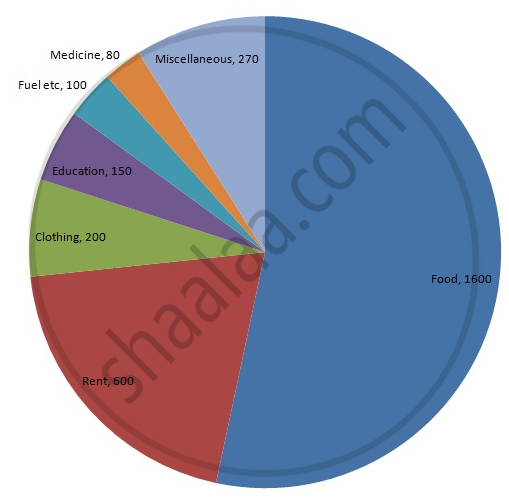
Following is the break up of the expenditure of a family on different items of consumption:
| Items | Food | Clothing | Rent | Education | Fuel etc. | Medicine | Miscellaneous |
| Expenditure (in Rs) | 1600 | 200 | 600 | 150 | 100 | 80 | 270 |
Draw a pie-diagram to represent the above data.
Solution
We know:
Central angle of a component = (component value/sum of component values x 360)
Here, total expenditure = Rs 3000
Thus, central angle for each component can be calculated as follows:
| Item | Expenditure (in Rs) | Sector angle |
| Food | 1600 | 1600/3000 x 360 = 192 |
| Clothing | 200 | 200/3000 x 360 = 24 |
| Rent | 600 | 600/3000 x 360 = 72 |
| Education | 150 | 150/3000 x 360 = 18 |
| Fuel etc | 100 | 100/3000 x 360 = 12 |
| Medicine | 80 | 80/3000 x 360 = 9.6 |
| Miscellaneous | 270 | 270/3000 x 360 = 32.4 |
Total : 3000 (in Rs)
Now, the pie chat representing the given data can be constructed by following the steps below:
Step 1 : Draw a circle of an appropriate radius.
Step 2 : Draw a vertical radius of the circle drawn in step 1.
Step 3 : Choose the largest central angle. Here, the largest central angle is 192o. Draw a sector with the central angle 192o in such a way that one of its radii coincides with the radius drawn in step 2 and another radius is in its counter clockwise direction.
Step 4 : Construct other sectors representing the other items in the clockwise sense in descending order of magnitudes of their central angles.
Step 5 : Shade the sectors with different colours and label them as shown in the figure below.
APPEARS IN
RELATED QUESTIONS
The adjoining pie chart gives the marks scored in an examination by a student in Hindi, English, Mathematics, Social Science and Science. If the total marks obtained by the students were 540, answer the following questions.
- In which subject did the student score 105 marks?
(Hint: For 540 marks, the central angle = 360°. So, for 105 marks, what is the central angle?) - How many more marks were obtained by the student in Mathematics than in Hindi?
- Examine whether the sum of the marks obtained in Social Science and Mathematics is more than that in Science and Hindi.
(Hint: Just study the central angles)

In a tree plantation programme, the number of trees planted by students of different classes is given in the following table. Draw a pie diagram showing the information.
| Standard | 5th | 6th | 7th | 8th | 9th | 10th |
| No. of trees | 40 | 50 | 75 | 50 | 70 | 75 |
The annual investments of a family are shown in the adjacent pie diagram. Answer the following questions based on it.
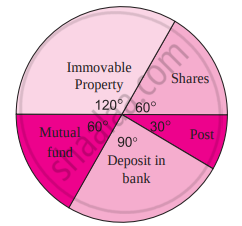
(1) If the investment in shares is ₹ 2000, find the total investment.
(2) How much amount is deposited in the bank?
(3) How much more money is invested in immovable property than in mutual fund?
(4) How much amount is invested in post?
The number of hours, spent by a school boy on different activities in a working day, is given below:
| Activities | Sleep | School | Home | Play | Others | Total |
| Number of hours | 8 | 7 | 4 | 2 | 3 | 24 |
Present the information in the form of a pie-chart.
Percentage of the different products of a village in a particular district are given below. Draw a pie-chart representing this information.
| Items | Wheat | Pulses | Jwar | Grounnuts | Vegetables | Total |
| % | `125/3` | `125/6` | `25/2` | `50/3` | `25/3` | 100 |
Represent the following data with the help of a pie-diagram:
| Items | Wheat | Rice | Tea |
| Production (in metric tons) | 3260 | 1840 | 900 |
The pie-chart given in the following represents the expenditure on different items in constructing a flat in Delhi. If the expenditure incurred on cement is Rs 112500, find the following:
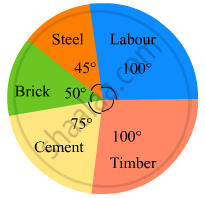
(i) Total cost of the flat.
(ii) Expenditure incurred on labour.
The following pie-chart shows the number of students admitted in different faculties of a college. If 1000 students are admitted in Science answer the following:
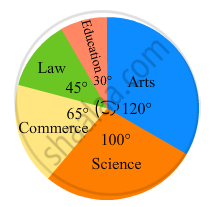
(i) What is the total number of students?
(ii) What is the ratio of students in science and arts?
The following table shows the daily supply of electricity to different places in a town. To show the information by a pie diagram, measures of central angles of sectors are to be decided.
Complete the following activity to find the measure :
| Places |
Supply of electricity |
Measure of central angle |
| Roads | 4 | `4/30 xx 360 = 48^circ` |
| Factories | 12 | `square/square xx 360 = 144^circ` |
| shops | 6 | `6/30 xx 360 = square` |
| Houses | 8 | `square/square xx 360 = square` |
| Total ⇒ | 30 | `square` |
The following table shows causes of noise pollution. Show it by a pie diagram.
|
Construction
|
Traffic | Aircraft take offs | Industry | Trains |
| 10% | 50% | 9% | 20% | 11% |
The number of hours, spent by a school boy in different activities in a day is given below :
| Activity | Sleep | School | Play | Homework | Others | Total |
| Number of Hours | 7 | 7 | 2 | 4 | 4 | 24 |
Represent the above information using a pie diagram.
Draw a pie-chart for the favourite sweets of your family members
Collect information about the favorite pets of your classmates. Draw bar-graph and pie-chart for the same data
A geometric representation showing the relationship between a whole and its parts is a ______.
The following pie chart represents the distribution of proteins in parts of a human body. What is the ratio of distribution of proteins in the muscles to that of proteins in the bones?

The central angle of a sector in a pie chart cannot be more than 180°.
In a pie chart two or more central angles can be equal.
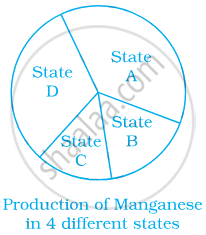
From the given pie chart, we can infer that production of Manganese is least in state B.
The following data represents the different number of animals in a zoo. Prepare a pie chart for the given data.
| Animals | Number of animals |
| Deer | 42 |
| Elephant | 15 |
| Giraffe | 26 |
| Reptiles | 24 |
| Tiger | 13 |
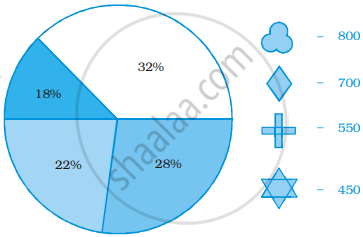
Identify which symbol should appear in each sector.