Advertisements
Advertisements
Question
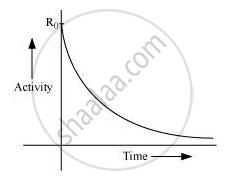
Plot a graph showing variation of activity of a given radioactive sample with time.
Solution

APPEARS IN
RELATED QUESTIONS
A radioactive nucleus has a decay constant λ = 0.3465 (day)–1. How long would it take the nucleus to decay to 75% of its initial amount?
Define ‘activity’ of a radioactive material and write its S.I. units.
State the law of radioactive decay. hence derive the relation N = Noe-λt . Represent it graphically.
Radioactive 131I has a half-life of 8.0 days. A sample containing 131I has activity 20 µCi at t = 0. (a) What is its activity at t = 4 days? (b) What is its decay constant at t = 4.0 days?
The count rate of nuclear radiation coming from a radiation coming from a radioactive sample containing 128I varies with time as follows.
| Time t (minute): | 0 | 25 | 50 | 75 | 100 |
| Ctount rate R (109 s−1): | 30 | 16 | 8.0 | 3.8 | 2.0 |
(a) Plot In (R0/R) against t. (b) From the slope of the best straight line through the points, find the decay constant λ. (c) Calculate the half-life t1/2.
A charged capacitor of capacitance C is discharged through a resistance R. A radioactive sample decays with an average-life τ. Find the value of R for which the ratio of the electrostatic field energy stored in the capacitor to the activity of the radioactive sample remains constant in time.
Radioactive isotopes are produced in a nuclear physics experiment at a constant rate dN/dt = R. An inductor of inductance 100 mH, a resistor of resistance 100 Ω and a battery are connected to form a series circuit. The circuit is switched on at the instant the production of radioactive isotope starts. It is found that i/N remains constant in time where i is the current in the circuit at time t and N is the number of active nuclei at time t. Find the half-life of the isotope.
Plot a graph showing the variation of undecayed nuclei N versus time t. From the graph, find out how one can determine the half-life and average life of the radioactive nuclei.
The half-life of a certain radioactive element is 3.465 days. Find its disintegration constant.
Half-life of a certain radioactive material is 8 hours.
Find the disintegration constant of this material.
