Advertisements
Advertisements
Question
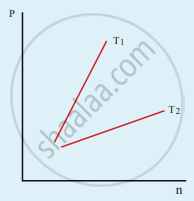
The following graph represents the pressure versus number density for an ideal gas at two different temperatures T1 and T2. The graph implies

Options
T1 = T2
T1 > T2
T1 < T2
Cannot be determined
Solution
T1 > T2
APPEARS IN
RELATED QUESTIONS
A sample of an ideal gas is at equilibrium. Which of the following quantity is zero?
What is the microscopic origin of pressure?
A gas is at temperature 80°C and pressure 5 × 10⁻¹⁰ Nm−2. What is the number of molecules per m3 if Boltzmann’s constant is 1.38 × 10⁻²³ J K−1
If 1020 oxygen molecules per second strike 4 cm2 of wall at an angle of 30° with the normal when moving at a speed of 2 × 10³ ms−1, find the pressure exerted on the wall. (mass of one oxygen atom = 2.67 × 10⁻²⁶ kg)
Estimate the total number of air molecules in a room of a capacity of 25 m3 at a temperature of 27°C.
According to the assumptions made in the kinetic theory of gases, when two molecules of a gas collide with each other, then ______.
Derive an expression for the pressure exerted by a gas on the basis of the kinetic theory of gases.
What is an ideal gas?
The kinetic energy per molecule of a gas at temperature T is ______.
Temperature remaining constant, if you double the number of molecules in a box, the pressure will ______.
