Advertisements
Advertisements
Question
The marks obtained by 100 students of a class in an examination are given below.
| Marks | No. of students |
| 0-5 | 2 |
| 5-10 | 5 |
| 10-15 | 6 |
| 15-20 | 8 |
| 20-25 | 10 |
| 25-30 | 25 |
| 30-35 | 20 |
| 35-40 | 18 |
| 40-45 | 4 |
| 45-50 | 2 |
Draw 'a less than' type cumulative frequency curves (orgive). Hence find median
Solution
| Marks | No. of students | Marks less than | Cumulative frequency |
| 0-5 | 2 | Less than 5 | 2 |
| 5-10 | 5 | Less than 10 | 7 |
| 10-15 | 6 | Less than 15 | 13 |
| 15-20 | 8 | Less than 20 | 21 |
| 20-25 | 10 | Less than 25 | 31 |
| 25-30 | 25 | Less than 30 | 56 |
| 30-35 | 20 | Less than 35 | 76 |
| 35-40 | 18 | Less than 40 | 94 |
| 40-45 | 4 | Less than 45 | 98 |
| 45-50 | 2 | Less than 50 | 100 |
Let us now plot the points corresponding to the ordered pairs (5, 2), (10, 7) (15,13), (20, 21), (25,31), (30,56), (35,76), (40,94), (45,98), (50,100). Join all the points by a smooth curve.
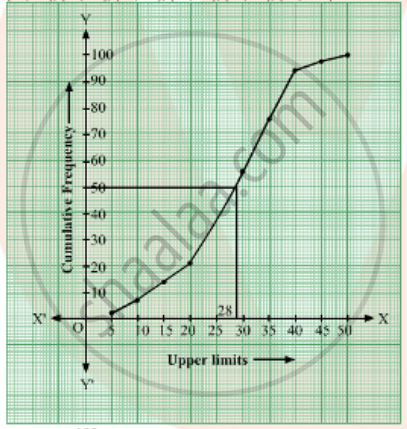
Locate `"n"/2 = 100/2 = 50` on Y-axis
From this point draw a line parallel to X-axis cutting the curve at a point. From this point, draw a perpendicular to X-axis. The point of intersection of perpendicular with the X-axis determines the median of the data. Therefore median = 28.8
APPEARS IN
RELATED QUESTIONS
The daily wages of 80 workers in a project are given below.
| Wages (in Rs.) |
400-450 | 450-500 | 500-550 | 550-600 | 600-650 | 650-700 | 700-750 |
| No. of workers |
2 | 6 | 12 | 18 | 24 | 13 | 5 |
Use a graph paper to draw an ogive for the above distribution. (Use a scale of 2 cm = Rs. 50 on x-axis and 2 cm = 10 workers on y-axis). Use your ogive to estimate:
- the median wage of the workers.
- the lower quartile wage of workers.
- the numbers of workers who earn more than Rs. 625 daily.
The following table gives production yield per hectare of wheat of 100 farms of a village:
| Production yield in kg per hectare: | 50 - 55 | 55 - 60 | 60 - 65 | 65 - 70 | 70 - 75 | 75 - 80 |
| Number of farms: | 2 | 8 | 12 | 24 | 38 | 16 |
Draw ‘less than’ ogive and ‘more than’ ogive.
Draw a cumulative frequency curve (ogive) for the following distributions:
| Class Interval | 10 – 15 | 15 – 20 | 20 – 25 | 25 – 30 | 30 – 35 | 35 – 40 |
| Frequency | 10 | 15 | 17 | 12 | 10 | 8 |
Draw a cumulative frequency curve (ogive) for the following distributions:
| Class Interval | 10 – 19 | 20 – 29 | 30 – 39 | 40 – 49 | 50 – 59 |
| Frequency | 23 | 16 | 15 | 20 | 12 |
Construct a frequency distribution table for the following distributions:
| Marks (more than) | 0 | 10 | 20 | 30 | 40 | 50 | 60 | 70 | 80 | 90 | 100 |
| Cumulative frequency | 100 | 87 | 65 | 55 | 42 | 36 | 31 | 21 | 18 | 7 | 0 |
Draw an ogive for the following :
| Class Interval | 0-10 | 10-20 | 20-30 | 30-40 | 40-50 |
| Frequency | 8 | 12 | 10 | 14 | 6 |
Draw an ogive for the following :
| Class Interval | 100-150 | 150-200 | 200-250 | 250-300 | 300-350 | 350-400 |
| Frequency | 10 | 13 | 17 | 12 | 10 | 8 |
Draw an ogive for the following :
| Marks (More than) | 0 | 10 | 20 | 30 | 40 | 50 | 60 | 70 | 80 | 90 | 100 |
| Cumulative Frequency | 100 | 87 | 65 | 55 | 42 | 36 | 31 | 21 | 18 | 7 | 0 |
The frequency distribution of scores obtained by 230 candidates in a medical entrance test is as ahead:
| Cost of living Index | Number of Months |
| 400 - 450 | 20 |
| 450 - 500 | 35 |
| 500 - 550 | 40 |
| 550 - 600 | 32 |
| 600 - 650 | 24 |
| 650 - 700 | 27 |
| 700 - 750 | 18 |
| 750 - 800 | 34 |
| Total | 230 |
Draw a cummulative polygon (ogive) to represent the above data.
Cumulative frequency curve is also called ______.
