Advertisements
Advertisements
प्रश्न
Find the missing frequencies and the median for the following distribution if the mean is 1.46.
| No. of accidents: | 0 | 1 | 2 | 3 | 4 | 5 | Total |
| Frequency (No. of days): | 46 | ? | ? | 25 | 10 | 5 | 200 |
उत्तर
| No. of accidents (x) |
No. of days (f) | fx |
| 0 | 45 | 0 |
| 1 | x | x |
| 2 | y | 2y |
| 3 | 25 | 75 |
| 4 | 10 | 40 |
| 5 | 5 | 25 |
| N = 200 | `sumf_1x_1=x+2y+140` |
Given, N = 200
⇒ 46 + x + y + 25 + 10 + 5 = 200
⇒ 86 + x + y = 200
⇒ x + y = 200 - 86
⇒ x+ y = 114 ..............(1)
And Mean = 1.46
`rArr(sumfx)/N=1.46`
`rArr(x+2y+140)/200=1.46`
⇒ x + 2y + 140 = 1.46 x 200
⇒ x + 2y + 140 = 292
⇒ x + 2y = 292 - 140
⇒ x + 2y = 152 ................(2)
Subtract equation (1) from equation (2)
⇒ x + 2y - (x+ y) = 152 - 114
⇒ x + 2y - x - y = 38
⇒ y = 38
Put the value of y in (1),
⇒ x+ y = 114
⇒ x + 38 = 114
⇒ x = 114 - 38
⇒ x = 76
Hence, the missing frequencies are 38 and 76.
(2) Calculation of median.
| No. of accidents (x) |
No. of days (f) | Cumulative Frequency |
| 0 | 45 | 46 |
| 1 | 76 | 122 |
| 2 | 38 | 160 |
| 3 | 25 | 185 |
| 4 | 10 | 195 |
| 5 | 5 | 200 |
| N = 200 |
We have
N = 200
So, `N/2=200/2=100`
Thus, the cumulative frequency just greater than 100 is 122 and the value corresponding to 122 is 1.
Hence, the median is 1.
APPEARS IN
संबंधित प्रश्न
The mean of following numbers is 68. Find the value of ‘x’. 45, 52, 60, x, 69, 70, 26, 81 and 94. Hence, estimate the median.
The numbers 6, 8, 10, 12, 13 and x are arranged in an ascending order. If the mean of the observations is equal to the median, find the value of x
The following table gives the frequency distribution of married women by age at marriage:
| Age (in years) | Frequency |
| 15-19 | 53 |
| 20-24 | 140 |
| 25-29 | 98 |
| 30-34 | 32 |
| 35-39 | 12 |
| 40-44 | 9 |
| 45-49 | 5 |
| 50-54 | 3 |
| 55-59 | 3 |
| 60 and above | 2 |
Calculate the median and interpret the results.
The marks obtained by 19 students of a class are given below:
27, 36, 22, 31, 25, 26, 33, 24, 37, 32, 29, 28, 36, 35, 27, 26, 32, 35 and 28.
Find:
- Median
- Lower quartile
- Upper quartile
- Inter-quartile range
From the following data, find:
Median
25, 10, 40, 88, 45, 60, 77, 36, 18, 95, 56, 65, 7, 0, 38 and 83
Calculate the median from the following data:
| Height(in cm) | 135 - 140 | 140 - 145 | 145 - 150 | 150 - 155 | 155 - 160 | 160 - 165 | 165 - 170 | 170 - 175 |
| Frequency | 6 | 10 | 18 | 22 | 20 | 15 | 6 | 3 |
If the median of the following frequency distribution is 32.5, find the values of `f_1 and f_2`.
| Class | 0 – 10 | 10 – 20 | 20 – 30 | 30 -40 | 40 – 50 | 50 – 60 | 60 – 70 | Total |
| Frequency | `f_1` |
5 |
9 | 12 | `f_2` | 3 | 2 | 40 |
Find the median wages for the following frequency distribution:
| Wages per day (in Rs) | 61 – 70 | 71 – 80 | 81 – 90 | 91 – 100 | 101 – 110 | 111 – 120 |
| No. of women workers | 5 | 15 | 20 | 30 | 20 | 8 |
The following frequency distribution table gives the ages of 200 patients treated in a hospital in a week. Find the mode of ages of the patients.
| Age (years) | Less than 5 | 5 - 9 | 10 - 14 | 15 - 19 | 20 - 24 | 25 - 29 |
| No. of patients | 38 | 32 | 50 | 36 | 24 | 20 |
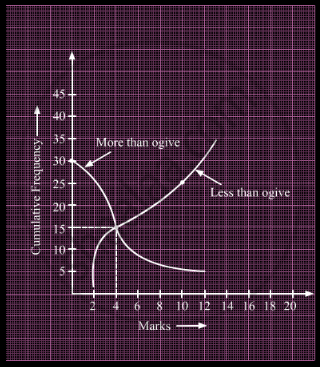
What is the value of the median of the data using the graph in the following figure of less than ogive and more than ogive?

