Advertisements
Advertisements
Question
Draw the graphs of linear equations y = x and y = – x on the same cartesian plane. What do you observe?
Solution
The given equation is y = x. To draw the graph of this equation, we need at least two points lying on the given line.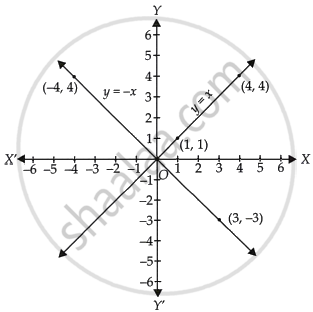
For x = 1, y = 1, therefore (1, 1) satisfies the linear equation y = x.
For x = 4, y = 4, therefore (4, 4) satisfies the linear equation y = x.
By plotting the points (1, 1) and (4, 4) on the graph paper and joining them by a line, we obtain the graph of y = x.
The given equation is y = – x. To draw the graph of this equation, we need at least two points lying on the given line.
For x = 3, y = – 3, therefore, (3, – 3) satisfies the linear equation y = – x.
For x = – 4, y = 4, therefore, (– 4, 4) satisfies the linear equation y = – x.
By plotting the points (3, – 3) and (– 4, 4) on the graph paper and joining them by a line, we obtain the graph of y = – x.
We observe that, the line y = x and y = – x intersect at the point O(0, 0).
APPEARS IN
RELATED QUESTIONS
Give the equations of two lines passing through (2, 14). How many more such lines are there, and why?
The taxi fare in a city is as follows:- For the first kilometre, the fare is Rs. 8 and for the subsequent distance it is Rs. 5 per km. Taking the distance covered as x km and total fare as Rs y, write a linear equation for this information, and draw its graph.
Draw the graph of the following linear equation in two variable : y = 2x
Draw the graph of the straight line given by the equation 4x - 3y + 36 = 0
Calculate the area of the triangle formed by the line drawn and the co-ordinate axes.
Use graph paper for this question. Take 2 cm = 2 units on x-axis and 2 cm = 1 unit on y-axis.
Solve graphically the following equation:
3x + 5y = 12; 3x - 5y + 18 = 0 (Plot only three points per line)
Draw the graphs of the following linear equations:
3x + 2y - 6 = 0
A straight line passes through the points (2, 5) and (-4, -7). Plot these points on a graph paper and draw the straight line passes through these points. If points (a, -1) and (-5, b) lie on the line drawn, find the value of a and b.
Draw the graph for the following
3x + 2y = 14
Find the values.
2x + y − 6 = 0
| x | 0 | − 1 | ||
| y | 0 | − 2 |
The graph of the linear equation y = x passes through the point ______.
