Advertisements
Advertisements
Question
Show that the points A(1, 2), B(– 1, – 16) and C(0, – 7) lie on the graph of the linear equation y = 9x – 7.
Solution
Firstly, to draw the graph of equation y = 9x – 7
When x = 2, then y = 9 × 2 – 7
= 18 – 7
= 11
When x = – 2, then y = 9 × – 2 – 7
= – 18 – 7
= – 25
| x | 2 | – 2 |
| y | 11 | – 25 |
Here, we find two points D(2, 11) and E(–2, – 25).
So, draw the graph by plotting the points and joining the line DE.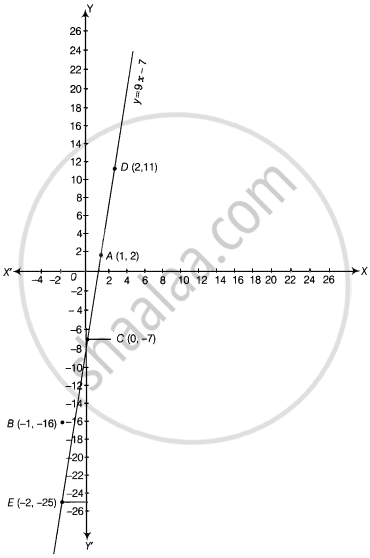
Now, we plot the given points A(1, 2), B(–1, –16) and C(0, –7) on the graph paper. We see that all the points lie on DE line.
APPEARS IN
RELATED QUESTIONS
In countries like USA and Canada, temperature is measured in Fahrenheit, whereas in countries like India, it is measured in Celsius. Here is a linear equation that converts Fahrenheit to Celsius:-
`F=(9/5)C+32`
(i) Draw the graph of the linear equation above using Celsius for x-axis and Fahrenheit for y-axis.
(ii) If the temperature is 30°C, what is the temperature in Fahrenheit?
(iii) If the temperature is 95°F, what is the temperature in Celsius?
(iv) If the temperature is 0°C, what is the temperature in Fahrenheit and if the temperature is 0°F, what is the temperature in Celsius?
(v) Is there a temperature which is numerically the same in both Fahrenheit and Celsius? If yes, find it.
Draw the graph of the following linear equation in two variable : y = 2x
Draw the graph of the following linear equations in two variable : 2𝑦 = −𝑥 + 1
Draw the graph of the equation given below. Also, find the coordinates of the point
where the graph cuts the coordinate axes : −x + 4y = 8
Draw the graph of the equation 2x + y = 6. Shade the region bounded by the graph and the
coordinate axes. Also, find the area of the shaded region.
Draw the graph of y = | x | + 2.
Draw the graph for the equation, given below :
2x + 3y = 0
Use graph paper for this question. Take 2 cm = 1 unit on both the axes.
- Draw the graphs of x + y + 3 = 0 and 3x - 2y + 4 = 0. Plot only three points per line.
- Write down the coordinates of the point of intersection of the lines.
- Measure and record the distance of the point of intersection of the lines from the origin in cm.
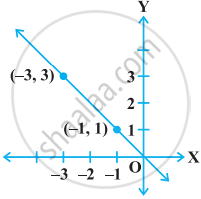
The graph given below represents the linear equation x + y = 0.
Determine the point on the graph of the linear equation 2x + 5y = 19, whose ordinate is `1 1/2` times its abscissa.
