Advertisements
Advertisements
Question
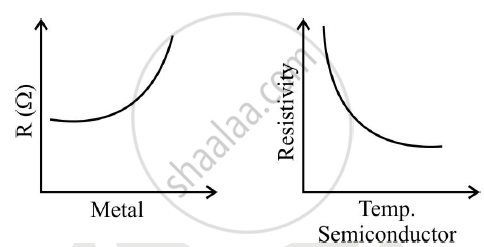
Draw labelled graphs to show how electrical resistance varies with temperature for:
1) a metallic wire.
2) a piece of carbon
Solution

APPEARS IN
RELATED QUESTIONS
Show variation of resistivity of Si with temperature in a graph ?
As the temperature of a metallic resistor is increased, the product of its resistivity and conductivity ____________ .
The resistance of an iron wire and a copper wire at 20°C are 3.9 Ω and 4.1 Ω, respectively. At what temperature will the resistance be equal? Temperature coefficient of resistivity for iron is 5.0 × 10⁻³ K–1 and for copper, it is 4.0 × 10⁻³ K–1. Neglect any thermal expansion.
As temperature increases, the viscosity of liquids decreases considerably. Will this decrease the resistance of an electrolyte as the temperature increases?
An electric kettle used to prepare tea, takes 2 minutes to boil 4 cups of water (1 cup contains 200 cc of water) if the room temperature is 25°C. (a) If the cost of power consumption is Re 1.00 per unit (1 unit = 1000 watt-hour), calculate the cost of boiling 4 cups of water. (b) What will be the corresponding cost if the room temperature drops to 5°C?
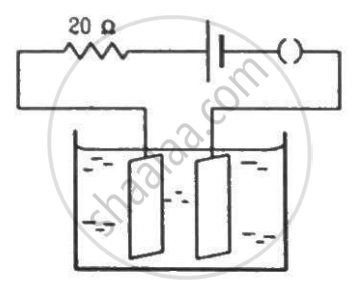
The figure shows an electrolyte of AgCl through which a current is passed. It is observed that 2.68 g of silver is deposited in 10 minutes on the cathode. Find the heat developed in the 20 Ω resistor during this period. Atomic weight of silver is 107.9 g/mol−1.

Find the thermo-emf developed in a copper-silver thermocouple when the junctions are kept at 0°C and 40°C. Use the data given in the following table.
| Metal with lead (Pb) |
a `mu V"/"^oC` |
b `muV"/("^oC)` |
| Aluminium | -0.47 | 0.003 |
| Bismuth | -43.7 | -0.47 |
| Copper | 2.76 | 0.012 |
| Gold | 2.90 | 0.0093 |
| Iron | 16.6 | -0.030 |
| Nickel | 19.1 | -0.030 |
| Platinum | -1.79 | -0.035 |
| Silver | 2.50 | 0.012 |
| Steel | 10.8 | -0.016 |
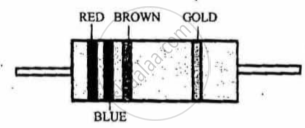
A carbon resistor has coloured bands as shown in Figure 2 below. The resistance of the resistor is:

figure 2
Define temperature coefficient of resistance of the material of a conductor.
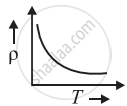
The temperature (T) dependence of resistivity of materials A and material B is represented by fig (i) and fig (ii) respectively. Identify material A and material B.
 fig. (i) |
 fig. (ii) |
